

Abstract
Branched‐chain keto‐acid dehydrogenase kinase (BCKDK) is the rate‐limiting enzyme of branched‐chain amino acid (BCAA) metabolism. In the last six years, BCKDK has been used as a kinase to promote tumor proliferation and metastasis. Renal cell carcinoma (RCC) is a highly vascularized tumor. A high degree of vascularization promotes tumor metastasis. Our objective is to explore the relationship between BCKDK and RCC metastasis and its specific mechanism. In our study, BCKDK is highly expressed in renal clear cell carcinoma and promotes the migration of clear cell renal cell carcinoma (ccRCC). Exosomes from ccRCC cells can promote vascular permeability and angiogenesis, especially when BCKDK is overexpressed in ccRCC cells. BCKDK can also augment the miR‐125a‐5p expression in ccRCC cells and derived exosomes, thereby decreasing the downstream target protein VE‐cadherin level, weakening adhesion junction expression, increasing vascular permeability, and promoting angiogenesis in HUVECs. The novel BCKDK/Exosome‐miR‐125a‐5p/VE‐cadherin axis regulates intercellular communication between ccRCC cells and HUVECs. BCKDK plays a critical role in renal cancer metastasis, may be used as a molecular marker of metastatic ccRCC, and even may become a potential target of clinical anti‐vascular therapy for ccRCC.
Keywords: BCKDK, clear cell renal cell carcinoma, exosome, microRNA, vascular permeability
On the one hand, BCKDK can directly affect RCC metastasis by regulating the MEK‐ERK signal. On the other hand, the new BCKDK/Exosomal miR‐125a‐5p/VE‐cadherin signal axis provides a new understanding of RCC angiogenesis, markers, and potential therapeutic targets for anti‐angiogenesis therapy of advanced RCC.

Abbreviations
- ATCC
American Type Culture Collection
- AUC
area under curve
- BCAA
branched‐chain amino acids
- BCKDH
branched‐chain α‐keto acid dehydrogenase
- BCKDK
branched‐chain keto‐acid dehydrogenase kinase
- ccRCC
clear cell renal cell carcinoma
- CM
conditioned medium
- DFS
disease‐free survival
- EGF
epidermal growth factor
- FBS
fetal bovine serum
- GO
Gene Ontology
- HCC
hepatocellular carcinoma
- IHC
immunohistochemistry
- KEGG
Kyoto Encyclopedia of Genes and Genomes
- KIRC
kidney renal clear cell carcinoma
- MVD
microvessel density
- OS
overall survival
- ROC
receiver operating characteristic
- RTK
receptor tyrosine kinase
- TKI
tyrosine kinase inhibitor
1. INTRODUCTION
Kidney cancer, also known as renal cell carcinoma (RCC), is the third most common tumor in urologic cancer, after prostate, and bladder cancer. In 2020, there were 431,288 new renal cancer cases worldwide (2.2% of new cases among all cancers), and renal cancer became the 10th most common cancer among males (2.7% of new cases of male cancer). 1 More than 25% of kidney cancer patients are diagnosed with metastatic diseases, and approximately 30% of local kidney cancer may develop into the metastatic stage. 2 Kidney cancer includes three histological subtypes, with clear cell renal cell carcinoma (ccRCC) accounting for approximately 75% of kidney cancers. 3 Due to the high vascularization of advanced kidney cancer, receptor tyrosine kinase (RTK) including VEGF receptors (VEGFR1, VEGFR2, and VEGFR3), is the first‐line treatment for targeted therapies for kidney cancer. 4
Branched‐chain keto‐acid dehydrogenase kinase (BCKDK) can phosphorylate the E1α subunit of branched‐chain α‐keto acid dehydrogenase (BCKDH), inhibit BCKDH activity, and negatively regulate BCAA metabolism. 5 Recent studies have shown that BCKDK has been demonstrated to be involved in cancer progression, especially in the MEK/ERK signaling pathway. BCKDK can affect tumorigenesis 6 and distant metastasis 7 in colorectal cancer by regulating the MEK/ERK signaling pathway. BCKDK can promote tumor proliferation and migration in ovarian cancer by activating the MEK/ERK axis. 8 BCKDK knockout in non‐small cell lung cancer can inhibit cancer cell proliferation and accelerate apoptosis. 9 Inhibiting BCKDK can increase the cytotoxicity of doxorubicin in triple‐negative breast cancer. 10 BCKDK has a positive function in cancer progression, but the correlation between BCKDK and kidney cancer has not yet been reported.
Exosomes, a type of extracellular vesicle with 30–150 nm diameter, containing enzymes, DNA, and non‐coding RNAs, can participate in many aspects of the immune response, 11 cell migration, 12 cell differentiation, 13 and angiogenesis. 14 MicroRNAs (miRNAs) are a class of non‐coding single‐stranded RNAs that combine 3′ untranslated regions of mRNA, leading to translation inhibition or mRNA degradation. 15 Recently, miRNAs carried by exosomes have become an area of intense research in urinary cancer. Increased hsa‐miR‐301a‐3p expression and decreased hsa‐miR‐1293 expression carried by exosomes could be a new potential marker of ccRCC metastasis. 16 In vitro, the ccRCC cell lines (786‐O, Caki‐2, and ACHN) can secrete exosomes carrying miR‐126‐3P into the culture medium, which HUVECs can take up for intercellular communication. 17 miR‐27a can target VE‐cadherin in HUVECs to play an antiangiogenic role. 18 However, the role of exosomal miRNAs secreted by ccRCC in tumor development remains unexplored.
This study intends to discover BCKDK expression in ccRCC and its role in the migration of ccRCC. We also aim to verify that BCKDK can positively regulate the miR‐125a‐5p expression in cells and exosomes in ccRCC, thereby affecting the downstream target protein VE‐cadherin in HUVECs and mediating the cell–cell junction and vascular permeability. These studies may be beneficial for understanding the mechanisms of ccRCC and provide new approaches to anti‐angiogenic therapy for renal cancer.
2. MATERIALS AND METHODS
2.1. Cell lines and cell culture
HUVECs, renal clear cell carcinoma cells (786‐O, Caki‐1, and ACHN), human kidney‐2 (HK2), and human renal epithelial cells (293T) were obtained from the ATCC. The renal clear cell carcinoma cell line (SN12C) was donated by Dr. Chung Leland W.K. (Cedars‐Sinai Medical Center). HUVECs were cultured in an ECM medium (ScienCell) containing 15% FBS (ScienCell). 786‐O, Caki‐1, and SN12C cells were cultured in RPMI 1640 medium (Gibco) with 10% FBS (Gibco). ACHN, HK2, and 293T cells were cultured in DMEM (Gibco) supplemented with 10% FBS. Cells were maintained at 37°C with 5% CO2 in a sterile and humidified environment.
2.2. Isolation, characterization, and quantification of exosomes
Caki‐1 and 786‐O cells with 70–80% confluence were cultured for 48 h in a medium supplemented with 10% exosome‐depleted FBS. The methods followed have been previously reported. 19 Exosomes were analyzed using transmission electron microscopy (TECNAI Spirit, FEI) and quantified using a MicroBCA Protein Assay Kit (ThermoFisher). For cell treatment, exosomes from 5 × 10⁶ cells (equivalent to 2 μg of exosomes) were added to 2 × 10⁵ endothelial cells.
2.3. Exosome labeling and cellular uptake
The exosomes were labeled with PKH67 (Sigma Aldrich) according to the manufacturer's instructions, resuspended and washed in 10% exosome‐depleted FBS‐ECM, supplemented to HUVECs, incubated for 4 h, and imaged under a fluorescence microscope (Carl Zeiss Microscopy, Germany).
2.4. RT‐qPCR and gel electrophoresis
Total RNA was extracted from the cells and exosomes using TRIzol RNA Isolation Reagents (ThermoFisher). PrimeScript RT Master Mix (Takara) was used for miRNA and mRNA reverse transcription. Then, RT‐qPCR was performed with Hieff qPCR SYBR Green Master Mix (Yeasen) using a CFX96 deep hole real‐time PCR detection system (BioRad). The sequences of primers are listed in Figure S1E,F. β‐Actin and U6 small nuclear RNA were used to normalize the results. RT‐PCR products were separated using 1% agarose gel electrophoresis and then imaged and quantified using Image Lab software (BioRad).
2.5. Protein extraction and western blotting
Cells were lysed with RIPA lysis buffer (Solarbio) containing protease (Solarbio) and phosphatase inhibitors (MedChemExpress) and quantified using the BCA assay (Sigma‐Aldrich). Protein lysates were subjected to SDS‐PAGE and transferred to a PVDF membrane (Merck Millipore). Then, the membranes were incubated overnight at 4°C with primary antibodies. Detailed information about primary and secondary antibodies is presented in Table S1. After incubation with a secondary antibody, the signal was detected with an enhanced chemiluminescence reagent (ThermoFisher) using C300 (Azure Biosystems).
2.6. RNA oligoribonucleotides and cell transfection
The miR‐125a‐5p mimics and inhibitors and their negative controls (NC) were provided by GenePharma. For in vitro experiments, sense (5′‐UCCCUGAGACCCUUUAACCUGUGA‐3′) and anti‐sense (5′‐ACAGGUUAAAGGGUCUCAGGGAUU‐3′) miR‐125a‐5p mimic oligos were synthesized. The miR‐125a‐5p inhibitor oligos were synthesized by sense (5′‐UCACAGGUUAAAGGGUCUCAGGGA‐3′). Cell transfection was performed according to the GenePharma manual. Briefly, cells were cultured in six‐well culture plates and transfected with miR‐125a‐5p mimics or inhibitors or their NC using Lipofectamine 3000 (Invitrogen) and incubated for 24 h before subsequent experiments.
2.7. Vectors, shRNA, and lentiviral infection
Vectors, including vehicle control shMock, pMD2.0G, psPAX2, and GFP, were purchased from Sino Biological. The FLAG‐BCKDK plasmid was constructed by our laboratory. A sea cucumber firefly dual luciferase reporter system (GenePharma) was used to verify whether the 684′‐UTR or 1080′‐UTR of VE‐cadherin mRNA were targeted by miR‐125a‐5p. The shBCKDK plasmids were donated by Prof. Feng Zhu (Department of Biochemistry and Molecular Biology, School of Basic Medicine, Huazhong University of Science and Technology). Four sequences were designed to knock down BCKDK; the shBCKDK sequences are listed in Table S2. Viral and packaging vectors were transfected into 293T cells using Lipofectamine 3000 according to the manufacturer's instructions.
2.8. Transendothelial invasion assay
For the transendothelial invasion assay, HUVECs were seeded in Transwell inserts (Corning) and cultured to the confluence with 1% BSA (Solarbio) as NC (equivalent to exosomes) or exosomes from different sources of ccRCC cells. The 786‐O cells were labeled with a GFP signal and suspended in a serum‐free medium in an upper chamber filled with a single layer of HUVECs, while 15% FBS was contained in the medium in the bottom chamber. After 12 h, cells in the upper chamber were erased, and the number of 786‐O‐GFP cells crossing a single layer of HUVECs was photographed and counted under a microscope. Similarly, the effect of miR‐125a‐5p on vascular permeability was tested.
2.9. EdU staining and angiogenesis assay
EdU staining (Biyuntian) was used to determine the effect of ccRCC‐exosomes on the proliferation of HUVECs. For the tube formation assay, Matrigel matrix (Corning) was laid in 24‐well plates and incubated at 37°C for 30 min before solidifying. Treated HUVECs were implanted into wells coated with matrix gel. After 12 h incubation, the tube formation was observed under a microscope.
2.10. Migration and wound healing assay
For migration assay, transwell inserts were used to investigate the migration ability of cells. In the upper chamber, 1 × 10⁵ cells were planted in a serum‐free medium, while the bottom chamber was filled with 15% FBS medium. The cells in the lower chamber were fixed with 4% paraformaldehyde, stained with 0.1% crystal violet solution (Yeasen), counted, and imaged under a microscope. For wound healing assay, ccRCC cells were cultured in a 6‐cm dish to 80% to 90% confluence and carefully scraped with a 200‐μL pipette tip. Different wound fields were imaged at respective time points (0 and 24 h) to assess the migration ability of cells.
2.11. Luciferase activity assay
The plasmids of VE‐cadherin 684′‐Untranslated Region (UTR) and 1080′‐UTR were co‐transfected with miR‐125a‐5p mimics or NC in 293T cells. Luciferase activity was measured 24 h after transfection using the Dual‐Luciferase Reporter Assay System (Promega). The 3′‐UTR of VE‐cadherin mRNA was used in the database.
2.12. Animal models and H&E
Athymic BALB/c nude mice (male 6‐week‐old) were purchased and housed in the Laboratory Animal Center of Xiamen University. For tumor metastasis assay, 2 × 10⁶ 786‐O cells or Caki‐1 cells were injected through the tail vein in nude mice. Then, nude mice were injected with 5 μg of exosomes (derived from the same kind of injected cells) through the tail vein every other day for 2 weeks. After 30 days, the nude mice were killed, and the lungs were removed for examination. The number of tumor nodules on the lung surface was counted and statistically evaluated. The collected lungs were fixed with 4% paraformaldehyde and subjected to H&E and immunohistochemistry (IHC).
2.13. Immunohistochemistry
After fixation with 4% paraformaldehyde, paraffin‐embedded tissue blocks were cut into 3‐μm thin sections and transferred onto slides. Then, sections were incubated with 3% hydrogen peroxide to block endogenous peroxidase activity and incubated with primary antibody for 30 min at 37°C and placed at 4°C overnight. Subsequently, slides were incubated with HRP‐linked secondary antibodies (Dako, Glostrup, Denmark). Slides were counterstained with Mayer's hematoxylin. The following primary antibodies were used: CD31 (Cell Signaling, 77699s, 1:100 dilution) and BCKDK (Santa Cruz, sc‐374425, 1:50 dilution). For BCKDK antibody staining, IHC scores were calculated according to the Remmele score. 20
2.14. Immunofluorescence
On glass coverslips, 293T cells grown were fixed for 10 min at room temperature with 4% paraformaldehyde, permeated with 0.2% Triton X‐100 for 15 min, blocked in 2% BSA for 30 min, and then incubated with primary antibody overnight at 4°C. On the second day, the cells were incubated with a fluorescent second antibody. Nuclei were stained with DAPI. The following primary antibodies were used: VE‐cadherin (Cell Signaling, 2500s, 1:200 dilution), β‐catenin (Cell Signaling, 8480s, 1:200 dilution), and Anti‐rabbit IgG (Alexa Fluor#488 Conjugate; Cell Signaling, 4412, 1:500 dilution).
2.15. Patient clinical samples
Sixty cases of RCC were collected at the initial diagnosis from Xiang’an Hospital of Xiamen University between 2019 and 2021. The clinicopathological characteristics and demographic information of the patients are summarized in Table S3. Ethical approval was obtained from the Medical Ethics Committee of Xiang’an Hospital, Xiamen University.
2.16. Statistical analysis
GraphPad Prism 8.0 software was used for statistical analysis. Values for all measurements were expressed as the mean ± standard deviation. The one‐way analysis of variance test and independent samples t‐test were used for normal distributed data. p < 0.05 was considered statistically significant (*p < 0.05, **p < 0.01, ***p < 0.001).
3. RESULTS
3.1. Branched‐chain keto‐acid dehydrogenase kinase is highly expressed in renal cell carcinoma
We explored the clinical correlation between BCKDK and renal cancer datasets and the relationship between BCKDK and overall survival (OS) and disease‐free survival (DFS) using The Cancer Genome Atlas (TCGA) database. We discovered that the BCKDK mRNA level was increased in various cancers, with the difference being especially significant in kidney renal clear cell carcinoma (KIRC; Figure 1A). The BCKDK mRNA expression was higher in unpaired and paired KIRC samples than in normal renal tissue samples (Figure 1B,C). Kaplan–Meier analysis of the correlation between BCKDK protein level and prognosis in KIRC demonstrated that the BCKDK protein level and OS did not differ significantly (p = 0.74), but the BCKDK protein level and DFS differ significantly (p = 0.015; Figure 1D,E). Moreover, according to the receiver operating characteristic (ROC) curve, the variable BCKDK has high accuracy in predicting normal and tumor outcomes in KIRC (AUC = 0.906, CI = 0.878–0.934; Figure 1F). Immunohistochemical staining was used to detect the BCKDK expression in different grades of RCC. The results indicated that the high BCKDK expression was significantly correlated with RCC in stage IV (p < 0.001) (Figure 1G,H). In conclusion, BCKDK was highly expressed in RCC and may be used as a molecule for clinical diagnosis.
FIGURE 1.

Branched‐chain keto‐acid dehydrogenase kinase (BCKDK) is highly expressed in renal cell carcinoma, especially in advanced renal cell carcinoma (RCC). Differential expression analysis of BCKDK on the RCC dataset was performed using TCGA by R language. (A) Differential expression of BCKDK in different cancers and normal tissues. (B) Differential expression of BCKDK in RCC and normal tissues. (C) Differential expression of BCKDK in RCC and their paired normal tissues (n = 72). (D and E) Kaplan–Meier analysis of overall survival (OS) and disease‐free survival (DFS) in RCC patients. (F) The receiver operating characteristic curve (ROC) curve shows the clinical correlation between BCKDK and RCC. KIRC data of TCGA and corresponding normal tissue data in GTEx were extracted. (G and H) immunohistochemistry (IHC)staining of BCKDK in different grades of RCC tissues. A representative visual field of IHC staining of BCKDK in patients with different grades of RCC is presented (×200 down; ×100 up). Scale bar, 100 μm. Center values in the graph represent means and error bars represent SD. *p < 0.05, **p < 0.01, ***p < 0.001, ns, not significant.
3.2. Branched‐chain keto‐acid dehydrogenase kinase facilitates angiogenesis by regulating exosomes from clear cell renal cell carcinoma cells
We detected the BCKDK expression in vitro in four cell lines of ccRCC and the renal epithelial cell HK2. The results demonstrated that BCKDK expression in ccRCC cells was higher than HK2 (Figure S1A,B). Subsequently, BCKDK was knocked down in Caki‐1 cell lines with high BCKDK expression and overexpressed in 786‐O cell lines with low BCKDK expression levels (Figure S1C,D). RNA was extracted from Caki‐1 cell lines (including group shMock and shBCKDK#1) for transcriptome mRNA sequencing. Sequencing results demonstrated that BCKDK knockdown could affect various molecules of the RCC‐related pathway (KEGG: 05211) and HIF‐1 signaling pathway (KEGG: 04066; Figure 2A). More detailed information is shown in Tables S4 and S5. Gene Ontology enrichment analysis revealed that BCKDK could affect extracellular exosomes in ccRCC cells (Figure 2B). KEGG pathway enrichment analysis indicated that BCKDK was closely related to miRNAs in cancer (Figure 2C). Based on the above sequencing results, we considered the correlation between BCKDK and exosomes in ccRCC cells.
FIGURE 2.
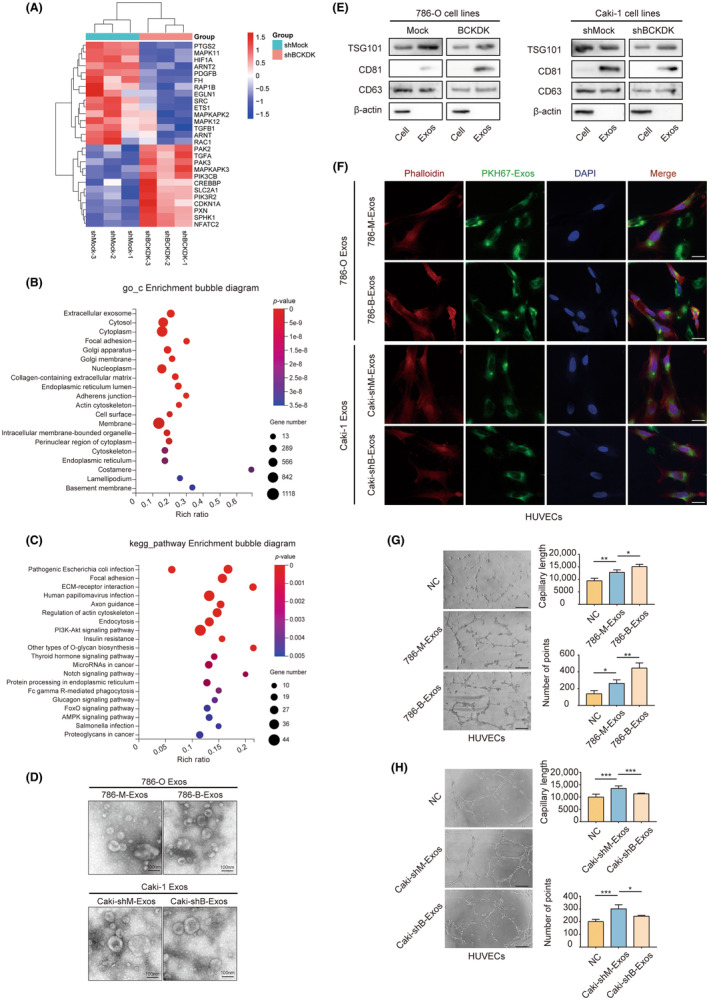
Branched‐chain keto‐acid dehydrogenase kinase (BCKDK) can promote angiogenesis by regulating exosomes derived from clear cell renal cell carcinoma (ccRCC) cells in vitro. (A) Heatmap of differentially expressed genes from the renal cell carcinoma (RCC)‐related pathway and the HIF‐1 signaling pathway. (B) Functional enrichment‐based clustering analysis of the KEGG pathway involved in BCKDK‐related signaling. (C) Results of Gene Ontology (GO) enrichment analysis. (D) Transmission electron microscopy of exosomes from ccRCC cells. Scale bar, 100 nm. (E) The expression of TSG101, CD81, CD63, and β‐actin in ccRCC cells and their exosomes were analyzed by western blotting. (F) Fluorescence images of HUVECs incubated with PKH67‐labeled exosomes from ccRCC cells. Red: Phalloidin; Green: PKH67; Blue: DAPI. Scale bar, 20 μm. Part of the field of vision has a PKH67 signal but no DAPI signal. This is probably caused by incomplete cell permeability during immunofluorescence staining. Neither the nucleus nor the cytoskeleton is labeled. However, exosomes first fuse with the cell membrane during uptake, and staining occurs even if the cell is not completely permeable. (G and H) Effects of exosomes derived from 786‐O cells (G) or Caki‐1 cells (H) when altering BCKDK expression level on angiogenesis ability of HUVECs by tube formation assay. Values are mean ± SEM with n = 3. Scale bar, 200 μm.
Therefore, we extracted exosomes from 786‐O‐Mock (786‐M‐Exos) or 786‐O‐BCKDK (786‐B‐Exos) cells and Caki‐1‐shMock (Caki‐shM‐Exos) or Caki‐1‐shBCKDK (Caki‐shB‐Exos) cells. The vesicle structure of exosomes from ccRCC cells was observed using transmission electron microscopy (Figure 2D). Exosomes exhibited the expression of exosome markers (Figure 2E). Exosomes were co‐cultured with HUVECs. Immunofluorescence results revealed that HUVECs could take up exosomes derived from ccRCC cells (Figure 2F).
Next, we explored the related mechanism of BCKDK that regulates angiogenesis in ccRCC. The results revealed that 786‐M‐Exos co‐cultured with HUVECs significantly increased tube formation compared to NC, while 786‐B‐Exos had a stronger ability to promote tube formation of HUVECs (Figure 2G). The Caki‐shB‐Exos may inhibit angiogenesis compared to Caki‐shM‐Exos (Figure 2H). Our results suggest that BCKDK can regulate exosomes from ccRCC cells to promote angiogenesis, but the exact mechanism remains to be elucidated.
3.3. Branched‐chain keto‐acid dehydrogenase kinase promotes angiogenesis by regulating exosomes from clear cell renal cell carcinoma cells in vivo
We injected ccRCC cells into nude mice via the tail vein, treated them with exosomes, and monitored tumor metastasis. The results indicated that the 786‐M‐Exos and 786‐B‐Exos could promote the lung metastasis of renal cancer cells in nude mice compared to NC. Moreover, 786‐B‐Exos revealed an obvious tumor‐promoting effect (Figure 3A). The lung tissue was removed for H&E staining, and the number and size of lung tumor formation were observed under the microscope. The exosome treatment group formed more tumors and had a larger scope of metastasis than NC, and 786‐B‐Exos had a stronger effect on tumor promotion and metastasis than the 786‐M‐Exos treatment group (Figure 3B). Exosomes derived from ccRCC cells can also affect microvessel density (MVD) in metastases, an indicator of angiogenesis. The exosome treatment group significantly increased MVD and the number of CD31‐positive cells in the metastases compared to the NC, and 786‐B‐Exos treatment enhanced these effects (Figure 3C). Exosomes derived from Caki‐1 cells produced similar results. Caki‐shM‐Exos significantly increased the number and extent of tumor formation in lung metastases and markedly increased the MVD in the metastases, but Caki‐shB‐Exos treatment reversed the pro‐metastasis and pro‐angiogenesis effects (Figure 3D–F).
FIGURE 3.

Exosomes from clear cell renal cell carcinoma (ccRCC) cells promote ccRCC metastasis in vivo. The nude mice were treated with exosomes for 14 days after ccRCC cells were injected into the tail vein. (A–C) Injection of 786‐O cells and treatment with exosomes from 786‐O cells. (A) Effects of 786‐M‐Exos or 786‐B‐Exos on tumor metastasis. The lungs were removed after 30 days. Lung metastatic sites are indicated by arrows. (B) H&E staining of the lungs. (C) immunohistochemistry (IHC) staining of CD31 positive cells. Representative views of H&E staining and IHC staining were presented (×400 down; ×100 up). Scale bar, 100 μm. (D–F) Injection of Caki‐1 cells and treatment with exosomes from Caki‐1 cells. (D) Effects of Caki‐shM‐Exos or Caki‐shB‐Exos on tumor metastasis. The lungs were removed after 30 days. Lung metastatic sites were indicated by arrows. (E) H&E staining of the lungs. (F) IHC staining of CD31 positive cells. Representative views of H&E staining and IHC staining were presented (×400 down; ×100 up). Scale bar, 100 μm. Values are mean ± SEM with n = 3.
3.4. Branched‐chain keto‐acid dehydrogenase kinase affects vascular permeability by regulating exosomes derived from clear cell renal cell carcinoma cells
Endothelial cell junctions are disorganized during blood vessel budding. This allows endothelial cell migration and proliferation but increases vascular permeability. 21 We discovered that both exosomes from ccRCC cells could significantly increase the proliferation ability of HUVECs by co‐culture of exosomes from 786‐O or Caki‐1 cells with HUVECs. This effect was enhanced via 786‐B‐Exos treatment or reversed via Caki‐shB‐Exos treatment (Figure 4A). We constructed a tumor cell penetrating vascular endothelial cell model to simulate the tumor cell crossing the vascular wall and entering the blood vessel. As expected, 786‐M‐Exos and Caki‐shM‐Exos could increase the number of tumor cells invading vascular endothelial cells compared to NC. 786‐B‐Exos could strongly promote the number of ccRCC cells through vascular endothelial cells, while Caki‐shB‐Exos reversed this process (Figure 4B).
FIGURE 4.

Branched‐chain keto‐acid dehydrogenase kinase (BCKDK) regulates exosomes derived from clear cell renal cell carcinoma (ccRCC) cells to affect vascular permeability. (A) BCKDK affected the proliferation of HUVECs by regulating exosomes derived from ccRCC cells in EdU staining. Scale bar, 200 μm. (B) Transendothelial invasion assay analysis of the number of GFP‐labeled 786‐O cells that invaded through a monolayer of HUVECs treating exosomes derived from 786‐O cells or Caki‐1 cells. Scale bar, 500 μm. Values are mean ± SEM with n = 3. (C) Western blot analysis of VE‐cadherin, β‐catenin, and p120‐catenin expression in HUVECs incubated with exosomes from ccRCC cells. (D and E) Immunofluorescence assay of VE‐cadherin (D) and β‐catenin (E) expression in HUVECs incubated with exosomes derived from ccRCC cells. Scale bar, 10 μm.
Intercellular junctions between endothelial cells are essential for maintaining vascular integrity and consist of adherent junctions and tight junctions. 22 The endothelial adhesion junction complex includes catenin (p120‐catenin and β‐catenin) and VE‐cadherin, the prominent cadherin at the endothelial cells adhesion junction. 21 Compared to NC, 786‐M‐Exos and Caki‐shM‐Exos could cause the loss of adhesion junction of vascular endothelial cells and the enhancement of cell permeability, among which the change of VE‐cadherin expression was the most obvious. As expected, 786‐B‐Exos significantly increased the loss of HUVECs adhesion linker molecules, whereas Caki‐shB‐Exos had no significant effect on vascular permeability (Figure 4C). Immunofluorescence assays yielded similar results (Figure 4D,E). In conclusion, our study demonstrates that BCKDK plays a positive role in the influence of renal cancer‐derived exosomes on vascular permeability, while the specific mechanism remains to be explored.
3.5. Branched‐chain keto‐acid dehydrogenase kinase positively regulates miR‐125a‐5p in clear cell renal cell carcinoma cells and exosomes
We first evaluated changes in VE‐cadherin mRNA levels after treatment with ccRCC‐derived exosomes. As shown in Figure 5A, there was no significant change in VE‐cadherin mRNA level, indicating that its mechanism might not be regulated through transcriptional regulation. The protein synthesis inhibitor cycloheximide was applied to HUVECs to evaluate the stability of the VE‐cadherin protein. The results showed no change between the exosome co‐culture groups, suggesting that the mechanism is not mediated by translation regulation (Figure 5B). Because miRNA transport between cells is stable, it can be secreted into exosomes to play an important role in intercellular signal transduction. We speculated that BCKDK could regulate certain miRNA, thereby affecting its gene silencing with VE‐cadherin in recipient cells.
FIGURE 5.

Branched‐chain keto‐acid dehydrogenase kinase (BCKDK) is positively correlated with miR‐125a‐5p expression in ccRCC cells and exosomes. (A) qRT‐PCR was used to test VE‐cadherin mRNA expression in HUVECs with exosomes from Caki‐1 or 786‐O cell co‐culture. (B) Western blotting was used to determine VE‐cadherin protein stability in HUVECs incubated with exosomes from Caki‐1 or 786‐O cells. (C) Venn diagram showing overlapping and different miRNAs predicted to target VE‐cadherin mRNA based on Targetscan, ENCORI, and miRDB databases. (D and E) RT‐PCR assay of expression levels of several miRNAs targeting VE‐cadherin in Caki‐1‐shMock and Caki‐1‐shBCKDK cells and gel electrophoresis of RT‐PCR products. (F) Correlation analysis of BCKDK and miR‐125a‐5p in KIRC based on TCGA database. (G) RT‐PCR assay of expression levels of miR‐125a‐5p in 786‐O‐Mock and 786‐O‐BCKDK cells and agarose gel electrophoresis analysis of RT‐PCR products. (H and I) RT‐PCR assay for miR‐125a‐5p expression of Caki‐shM‐Exos and Caki‐shB‐Exos (H) or 786‐M‐Exos and 786‐B‐Exos (I) and corresponding gel electrophoresis of RT‐PCR products. Values are mean ± SEM with n = 3. *p < 0.05, **p < 0.01, ***p < 0.001, according to two‐tailed Student's t‐test.
We used TargetScan, ENCORI, and miRDB databases to predict which miRNAs could target the mRNA of VE‐cadherin. Relevant results are shown in the Table S6. After a comprehensive analysis, we obtained seven different miRNAs. It included hsa‐miR‐27a, hsa‐miR‐22‐3p, hsa‐miR‐4319, hsa‐miR‐125a‐5p, hsa‐miR‐125b‐5p, hsa‐miR‐101‐3p, and hsa‐miR‐144‐3p (Figure 5C). After BCKDK knockdown, miR‐125a‐5p significantly decreased (10.3‐fold), followed by miR‐144‐3p (1.2‐fold) and miR‐101‐3p (0.2‐fold) (Figure 5D,E). Using R language statistics, we discovered that BCKDK and miR‐125a‐5p positively correlated with KIRC (Figure 5F). The relevant data are included in Table S7. Furthermore, when BCKDK was overexpressed in 786‐O cells, the miR‐125a‐5p expression was raised accordingly (Figure 5G). After BCKDK downregulation in Caki‐1 cells, miR‐125a‐5p expression in Caki‐shB‐Exos decreased. In contrast, miR‐125a‐5p expression in 786‐B‐Exos increased after BCKDK overexpression in 786‐O cells (Figure 5H,I). This indicates that BCKDK can still regulate miR‐125a‐5p expression in exosomes from ccRCC cells.
3.6. miR‐125a‐5p negatively regulates VE‐cadherin to increase vascular permeability
We transfected hsa‐miR‐125a‐5p mimics and inhibitors in HUVECs to verify the regulatory mechanism of miR‐125a‐5p on VE‐cadherin. The results demonstrated that transfection of miR‐125a‐5p mimics markedly reduced the VE‐cadherin protein expression (Figure 6A). In contrast, transfection of miR‐125a‐5p inhibitor in HUVECs significantly increased the adhesion junction molecules expression, including VE‐cadherin (Figure 6B). Immunofluorescence assay produced similar results (Figure 6C,D). For transendothelial invasion assays, transfection of miR‐125a‐5p mimics in HUVECs could increase the number of ccRCC cells crossing vascular endothelial cells, while transfection of miR‐125a‐5p inhibitors reduced this phenomenon (Figure 6E). We obtained two potential mRNA targets predicted by miR‐125a‐5p for binding VE‐cadherin using the TargetScan database. The In vitro gene mutation method was used to mutate VE‐cadherin 684′‐UTR and 1080′‐UTR to explore whether miR‐125a‐5p could bind to VE‐cadherin mRNA and which specific site played a role (Figure 6F). Dual luciferase reporter assay results revealed that miR‐125a‐5p could bind at 684′‐UTR of VE‐cadherin and inhibit the translation of VE‐cadherin but not at 1080′‐UTR (Figure 6G,H). In conclusion, our study demonstrated that miR‐125a‐5p could target the mRNA binding to VE‐cadherin and negatively regulate the VE‐cadherin expression, thereby increasing vascular permeability and promoting tumor cell metastasis.
FIGURE 6.

miR‐125a‐5p binds and inhibits VE‐cadherin in HUVECs and promotes vascular permeability. (A and B) RT‐PCR assay of miR‐125a‐5p expression in HUVECs transfected with miR‐125a‐5p mimics (A) or miR‐125a‐5p inhibitor (B) and their negative control (NC). Western blot analysis of VE‐cadherin, β‐catenin, and p120‐catenin expression in HUVECs transfected with miR‐125a‐5p mimics (A) or miR‐125a‐5p inhibitor (B) and their negative control (NC). (C and D) Immunofluorescence assay of VE‐cadherin (C) and β‐catenin (D) expression in HUVECs transfected with miR‐125a‐5p mimics or inhibitor and negative control (NC). Scale bar, 10 μm. (E) Transendothelial invasion assay analysis of the number of GFP‐labeled 786‐O cells that invaded through a monolayer of HUVECs transfected with miR‐125a‐5p mimics or miR‐125a‐5p inhibitor and negative control (NC). Scale bar, 500 μm. (F) The predicted binding of miR‐125a‐5p with VE‐cadherin 3′‐UTR was illustrated. The mutation sites are shown below. MUT, mutation; WT, wild type. (G and H) Dual‐luciferase reporter gene assay showed that miR‐125a‐5p inhibited the luciferase activity of reporter containing wild‐type 684′‐UTR but not mutant 684′‐UTR of VE‐cadherin (G). miR‐125a‐5p cannot decrease the luciferase activity at wild‐type and mutant 1080′‐UTR of VE‐cadherin (H). Values are mean ± SEM with n = 3. *p < 0.05, **p < 0.01, ***p < 0.001, according to two‐tailed Student's t‐test. ns, not significant.
3.7. Branched‐chain keto‐acid dehydrogenase kinase regulates tumor metastasis through the MEK/ERK pathway in clear cell renal cell carcinoma
Previous reports have confirmed that BCKDK is closely related to the MEK/ERK signaling pathway. We used epidermal growth factor (EGF) to deactivate MEK/ERK signaling to understand the role of BCKDK in regulating MEK/ERK signaling in ccRCC. 7 The phosphorylation signal is enhanced after BCKDK overexpression in 786‐O cells, while the phosphorylation signal is weakened after the knockdown of BCKDK in Caki‐1 cells (Figure 7A,B). Subsequently, we examined the role of BCKDK in regulating ccRCC cell migration. Transwell migration and wound healing assays revealed that BCKDK overexpression in 786‐O cells enhanced the migration ability of ccRCC cells, while BCKDK knockdown in Caki‐1 cells weakened this ability (Figure 7C–F), and EGF can promote the migration ability of ccRCC cells.
FIGURE 7.

Branched‐chain keto‐acid dehydrogenase kinase (BCKDK) promotes tumor metastasis through the MEK/ERK signaling pathway in clear cell renal cell carcinoma (ccRCC). (A and B) The effects of BCKDK overexpression or knockdown on the expression of p‐MEK1/2, t‐MEK1/2, p‐ERK1/2, and t‐ERK1/2 in 786‐O cells (A) or Caki‐1 cells (B) with or without epidermal growth factor (EGF) (80 ng/mL, 15 min) treatment. (C and D) Transwell cell migration assays of BCKDK overexpression (C) or knockdown (D) cells with or without EGF (20 ng/mL) treatment with representative images and quantification are shown. Scale bar, 100 μm. (E and F) Wound healing cell migration assays of BCKDK knockdown (E) or overexpression (F) cell lines with or without EGF (20 ng/mL) treatment. Scale bar, 50 μm. Values are mean ± SEM with n = 3. *p < 0.05, **p < 0.01, ***p < 0.001, according to two‐way ANOVA.
4. DISCUSSION
Recent studies have revealed that exosomes can mediate intercellular communication and regulate the tumor microenvironment. 23 Cancer cells can secrete more exosomes than normal cells, which are involved in tumor metastasis, 24 cell invasion, 25 and angiogenesis. 26 In this study, ccRCC cells‐derived exosomes significantly attenuated VE‐cadherin represented adhesion junction molecules (β‐catenin and p120‐catenin) in vascular endothelial cells, enhancing angiogenesis and vascular permeability in ccRCC.
Vascular permeability is partially dynamically regulated by VE‐cadherin and β‐catenin adhesion junction complexes. 27 Multiple adhesion junction molecules cooperate to maintain adhesion junction and vascular permeability. VE‐cadherin plays a unique and critical role in regulating vascular permeability and angiogenesis. Loss or inactivation of the VE‐cadherin gene in mice blocks normal blood vessel development. 28 The VE‐cadherin gene in zebrafish plays a non‐redundant role in maintaining cell‐to‐cell junctions. 29 Our results revealed that miR‐125a‐5p could target 684′‐UTR of VE‐cadherin and exert a translational inhibitory effect. Furthermore, miR‐125a‐5p can enhance vascular permeability and promote cancer cell trans‐endothelial cell metastasis in vitro.
Exosomal miRNAs can communicate between cancer and other stromal cells, especially the crosstalk with vascular endothelial cells, 30 and regulate the tumor microenvironment. 31 Exosomes can selectively enrich different miRNAs and enter the receptor cells through systemic circulation in a hormone‐like manner. 32 However, the specific mechanism is unclear, and sorting according to microRNA motif could play a role. 33 Nevertheless, there is no doubt that this approach is more targeted and efficient than traditional cell–cell communication. Our study also revealed that BCKDK could regulate the content of miR‐125a‐5p sorted into ccRCC‐derived exosomes. Furthermore, it regulates the transport of miR‐125a‐5p from ccRCC cells to vascular endothelial cells through exosomes.
Renal clear cell carcinoma is a highly vascularized tumor that is not very sensitive to conventional radiotherapy and chemotherapy. 34 Advanced renal clear cell carcinoma is mainly treated with molecular targeted therapy, especially anti‐angiogenesis therapy, VEGF monoclonal antibody, and VEGF receptor tyrosine kinase inhibitor (TKI). 35 There is crosstalk between VEGF monoclonal antibodies and TKI drugs, and TKI resistance often occurs during treatment. Therefore, identifying new targets for multi‐target drug combinations to treat advanced renal clear cell carcinoma patients with TKI resistance is urgent. VEGF can activate several VEGF receptors that belong to RTKs, 36 playing a critical role in endothelial function, including endothelial cell proliferation and angiogenesis. 37 Fibroblast growth factor can also promote endothelial cell proliferation 38 and lymphatic vascular development. 39
In conclusion, on the one hand, BCKDK can directly affect RCC metastasis by regulating the MEK–ERK signal. On the other hand, the new BCKDK/exosomal miR‐125a‐5p/VE‐cadherin signal axis provides a new understanding of RCC angiogenesis, markers, and potential therapeutic targets for anti‐angiogenesis therapy of advanced RCC (Figure 8). Our study showed that BCKDK may become a potential therapy target to affect tumor angiogenesis in vivo and in vitro.
FIGURE 8.

Schematic diagram of the role of branched‐chain keto‐acid dehydrogenase kinase (BCKDK) regulating tumor metastasis, vascular permeability, and angiogenesis in renal cell carcinoma.
ACKOWNLEDGMENTS
Anonymous reviewers have also made great contributions to the publication of this paper.
FUNDING INFORMATION
This work was supported by the Natural Science Foundation of China grants (No. 81972373) and the Scientific Research Foundation for Advanced Talents, Xiang’an Hospital of Xiamen University (No. PM201809170001).
CONFLICT OF INTEREST STATEMENT
The authors declare no conflict of interest.
ETHICS STATEMENTS
Approval of the research protocol by an Institutional Reviewer Board: N/A.
Informed Consent: N/A.
Registry and the Registration No. of the study/trial: N/A.
Animal Studies: Animal experiments were performed by protocols approved by the Animal Ethics Committee of Xiamen University School of Medicine.
Supporting information
Figure S1.
Table S1.
Table S2.
Table S3.
Table S4.
Table S5.
Table S6.
Table S7.
Yang K, Xu C, Sun H, et al. Branched‐chain keto‐acid dehydrogenase kinase regulates vascular permeability and angiogenesis to facilitate tumor metastasis in renal cell carcinoma. Cancer Sci. 2023;114:4270‐4285. doi: 10.1111/cas.15956
Kunao Yang, Chunlan Xu and Huimin Sun contributed equally to this work.
REFERENCES
- 1. Sung H, Ferlay J, Siegel RL, et al. Global cancer statistics 2020: GLOBOCAN estimates of incidence and mortality worldwide for 36 cancers in 185 countries. CA Cancer J Clin. 2021;71(3):209‐249. doi: 10.3322/caac.21660 [DOI] [PubMed] [Google Scholar]
- 2. Gill DM, Hahn AW, Hale P, Maughan BL. Overview of current and future first‐line systemic therapy for metastatic clear cell renal cell carcinoma. Curr Treat Options Oncol. 2018;19(1):6. doi: 10.1007/s11864-018-0517-1 [DOI] [PubMed] [Google Scholar]
- 3. Jonasch E, Walker CL, Rathmell WK. Clear cell renal cell carcinoma ontogeny and mechanisms of lethality. Nat Rev Nephrol. 2021;17(4):245‐261. doi: 10.1038/s41581-020-00359-2 [DOI] [PMC free article] [PubMed] [Google Scholar]
- 4. Barata PC, Rini BI. Treatment of renal cell carcinoma: current status and future directions. CA Cancer J Clin. 2017;67(6):507‐524. doi: 10.3322/caac.21411 [DOI] [PubMed] [Google Scholar]
- 5. East MP, Laitinen T, Asquith CRM. BCKDK: an emerging kinase target for metabolic diseases and cancer. Nat Rev Drug Discov. 2021;20(7):498. doi: 10.1038/d41573-021-00107-6 [DOI] [PubMed] [Google Scholar]
- 6. Xue P, Zeng F, Duan Q, et al. BCKDK of BCAA catabolism cross‐talking with the MAPK pathway promotes tumorigenesis of colorectal cancer. EBioMedicine. 2017;20:50‐60. doi: 10.1016/j.ebiom.2017.05.001 [DOI] [PMC free article] [PubMed] [Google Scholar]
- 7. Tian Q, Yuan P, Quan C, et al. Phosphorylation of BCKDK of BCAA catabolism at Y246 by Src promotes metastasis of colorectal cancer. Oncogene. 2020;39(20):3980‐3996. doi: 10.1038/s41388-020-1262-z [DOI] [PMC free article] [PubMed] [Google Scholar]
- 8. Li H, Yu D, Li L, et al. BCKDK promotes ovarian cancer proliferation and migration by activating the MEK/ERK signaling pathway. J Oncol. 2022;2022:3691635. doi: 10.1155/2022/3691635 [DOI] [PMC free article] [PubMed] [Google Scholar]
- 9. Wang Y, Xiao J, Jiang W, et al. BCKDK alters the metabolism of non‐small cell lung cancer. Transl Lung Cancer Res. 2021;10(12):4459‐4476. doi: 10.21037/tlcr-21-885 [DOI] [PMC free article] [PubMed] [Google Scholar]
- 10. Biswas D, Slade L, Duffley L, et al. Inhibiting BCKDK in triple negative breast cancer suppresses protein translation, impairs mitochondrial function, and potentiates doxorubicin cytotoxicity. Cell Death Dis. 2021;7(1):241. doi: 10.1038/s41420-021-00602-0 [DOI] [PMC free article] [PubMed] [Google Scholar]
- 11. Xu Z, Zeng S, Gong Z, Yan Y. Exosome‐based immunotherapy: a promising approach for cancer treatment. Mol Cancer. 2020;19(1):160. doi: 10.1186/s12943-020-01278-3 [DOI] [PMC free article] [PubMed] [Google Scholar]
- 12. Wu HJ, Hao M, Yeo SK, Guan JL. FAK signaling in cancer‐associated fibroblasts promotes breast cancer cell migration and metastasis by exosomal miRNAs‐mediated intercellular communication. Oncogene. 2020;39(12):2539‐2549. doi: 10.1038/s41388-020-1162-2 [DOI] [PMC free article] [PubMed] [Google Scholar]
- 13. Sun J, Jia H, Bao X, et al. Tumor exosome promotes Th17 cell differentiation by transmitting the lncRNA CRNDE‐h in colorectal cancer. Cell Death Dis. 2021;12(1):123. doi: 10.1038/s41419-020-03376-y [DOI] [PMC free article] [PubMed] [Google Scholar]
- 14. He C, Zheng S, Luo Y, Wang B. Exosome Theranostics: biology and translational medicine. Theranostics. 2018;8(1):237‐255. doi: 10.7150/thno.21945 [DOI] [PMC free article] [PubMed] [Google Scholar]
- 15. Mohr AM, Mott JL. Overview of microRNA biology. Semin Liver Dis. 2015;35(1):3‐11. doi: 10.1055/s-0034-1397344 [DOI] [PMC free article] [PubMed] [Google Scholar]
- 16. Dias F, Teixeira AL, Nogueira I, et al. Extracellular vesicles enriched in hsa‐miR‐301a‐3p and hsa‐miR‐1293 dynamics in clear cell renal cell carcinoma patients: potential biomarkers of metastatic disease. Cancers (Basel). 2020;12(6):1450. doi: 10.3390/cancers12061450 [DOI] [PMC free article] [PubMed] [Google Scholar]
- 17. Butz H, Nofech‐Mozes R, Ding Q, et al. Exosomal microRNAs are diagnostic biomarkers and can mediate cell‐cell communication in renal cell carcinoma. Eur Urol Focus. 2016;2(2):210‐218. doi: 10.1016/j.euf.2015.11.006 [DOI] [PubMed] [Google Scholar]
- 18. Young JA, Ting KK, Li J, et al. Regulation of vascular leak and recovery from ischemic injury by general and VE‐cadherin‐restricted miRNA antagonists of miR‐27. Blood. 2013;122(16):2911‐2919. doi: 10.1182/blood-2012-12-473017 [DOI] [PubMed] [Google Scholar]
- 19. Li P, Kaslan M, Lee SH, Yao J, Gao Z. Progress in exosome isolation techniques. Theranostics. 2017;7(3):789‐804. doi: 10.7150/thno.18133 [DOI] [PMC free article] [PubMed] [Google Scholar]
- 20. Regitnig P, Reiner A, Dinges HP, et al. Quality assurance for detection of estrogen and progesterone receptors by immunohistochemistry in Austrian pathology laboratories. Virchows Arch. 2002;441(4):328‐334. doi: 10.1007/s00428-002-0646-5 [DOI] [PubMed] [Google Scholar]
- 21. Dejana E. Endothelial cell‐cell junctions: happy together. Nat Rev Mol Cell Biol. 2004;5(4):261‐270. doi: 10.1038/nrm1357 [DOI] [PubMed] [Google Scholar]
- 22. Dejana E, Corada M, Lampugnani MG. Endothelial cell‐to‐cell junctions. FASEB J. 1995;9(10):910‐918. [PubMed] [Google Scholar]
- 23. Zhang L, Yu D. Exosomes in cancer development, metastasis, and immunity. Biochim Biophys Acta Rev Cancer. 2019;1871(2):455‐468. doi: 10.1016/j.bbcan.2019.04.004 [DOI] [PMC free article] [PubMed] [Google Scholar]
- 24. Li R, Wang Y, Zhang X, et al. Exosome‐mediated secretion of LOXL4 promotes hepatocellular carcinoma cell invasion and metastasis. Mol Cancer. 2019;18(1):18. doi: 10.1186/s12943-019-0948-8 [DOI] [PMC free article] [PubMed] [Google Scholar]
- 25. Sun X, Lin F, Sun W, et al. Exosome‐transmitted miRNA‐335‐5p promotes colorectal cancer invasion and metastasis by facilitating EMT via targeting RASA1. Mol Ther Nucleic Acids. 2021;24:164‐174. doi: 10.1016/j.omtn.2021.02.022 [DOI] [PMC free article] [PubMed] [Google Scholar]
- 26. Nazarenko I, Rana S, Baumann A, et al. Cell surface tetraspanin Tspan8 contributes to molecular pathways of exosome‐induced endothelial cell activation. Cancer Res. 2010;70(4):1668‐1678. doi: 10.1158/0008-5472.Can-09-2470 [DOI] [PubMed] [Google Scholar]
- 27. Ferreira Tojais N, Peghaire C, Franzl N, et al. Frizzled7 controls vascular permeability through the Wnt‐canonical pathway and cross‐talk with endothelial cell junction complexes. Cardiovasc Res. 2014;103(2):291‐303. doi: 10.1093/cvr/cvu133 [DOI] [PubMed] [Google Scholar]
- 28. Carmeliet P, Lampugnani MG, Moons L, et al. Targeted deficiency or cytosolic truncation of the VE‐cadherin gene in mice impairs VEGF‐mediated endothelial survival and angiogenesis. Cell. 1999;98(2):147‐157. doi: 10.1016/s0092-8674(00)81010-7 [DOI] [PubMed] [Google Scholar]
- 29. Montero‐Balaguer M, Swirsding K, Orsenigo F, Cotelli F, Mione M, Dejana E. Stable vascular connections and remodeling require full expression of VE‐cadherin in zebrafish embryos. PloS One. 2009;4(6):e5772. doi: 10.1371/journal.pone.0005772 [DOI] [PMC free article] [PubMed] [Google Scholar]
- 30. Xuan Z, Chen C, Tang W, et al. TKI‐resistant renal cancer secretes low‐level Exosomal miR‐549a to induce vascular permeability and angiogenesis to promote tumor metastasis. Front Cell Dev Biol. 2021;9:689947. doi: 10.3389/fcell.2021.689947 [DOI] [PMC free article] [PubMed] [Google Scholar]
- 31. Hsu YL, Hung JY, Chang WA, et al. Hypoxic lung cancer‐secreted exosomal miR‐23a increased angiogenesis and vascular permeability by targeting prolyl hydroxylase and tight junction protein ZO‐1. Oncogene. 2017;36(34):4929‐4942. doi: 10.1038/onc.2017.105 [DOI] [PubMed] [Google Scholar]
- 32. Valadi H, Ekström K, Bossios A, Sjöstrand M, Lee JJ, Lötvall JO. Exosome‐mediated transfer of mRNAs and microRNAs is a novel mechanism of genetic exchange between cells. Nat Cell Biol. 2007;9(6):654‐659. doi: 10.1038/ncb1596 [DOI] [PubMed] [Google Scholar]
- 33. Batagov AO, Kuznetsov VA, Kurochkin IV. Identification of nucleotide patterns enriched in secreted RNAs as putative cis‐acting elements targeting them to exosome nano‐vesicles. BMC Genomics. 2011;12(Suppl 3):S18. doi: 10.1186/1471-2164-12-s3-s18 [DOI] [PMC free article] [PubMed] [Google Scholar]
- 34. Qian CN, Huang D, Wondergem B, Teh BT. Complexity of tumor vasculature in clear cell renal cell carcinoma. Cancer. 2009;115(10 Suppl):2282‐2289. doi: 10.1002/cncr.24238 [DOI] [PubMed] [Google Scholar]
- 35. Lai Y, Zhao Z, Zeng T, et al. Crosstalk between VEGFR and other receptor tyrosine kinases for TKI therapy of metastatic renal cell carcinoma. Cancer Cell Int. 2018;18:31. doi: 10.1186/s12935-018-0530-2 [DOI] [PMC free article] [PubMed] [Google Scholar]
- 36. Micheli L, Parisio C, Lucarini E, et al. VEGF‐A/VEGFR‐1 signalling and chemotherapy‐induced neuropathic pain: therapeutic potential of a novel anti‐VEGFR‐1 monoclonal antibody. J Exp Clin Cancer Res. 2021;40(1):320. doi: 10.1186/s13046-021-02127-x [DOI] [PMC free article] [PubMed] [Google Scholar]
- 37. Olsson AK, Dimberg A, Kreuger J, Claesson‐Welsh L. VEGF receptor signalling ‐ in control of vascular function. Nat Rev Mol Cell Biol. 2006;7(5):359‐371. doi: 10.1038/nrm1911 [DOI] [PubMed] [Google Scholar]
- 38. Sahni A, Francis CW. Stimulation of endothelial cell proliferation by FGF‐2 in the presence of fibrinogen requires alphavbeta3. Blood. 2004;104(12):3635‐3641. doi: 10.1182/blood-2004-04-1358 [DOI] [PubMed] [Google Scholar]
- 39. Yu P, Wilhelm K, Dubrac A, et al. FGF‐dependent metabolic control of vascular development. Nature. 2017;545(7653):224‐228. doi: 10.1038/nature22322 [DOI] [PMC free article] [PubMed] [Google Scholar]
Associated Data
This section collects any data citations, data availability statements, or supplementary materials included in this article.
Supplementary Materials
Figure S1.
Table S1.
Table S2.
Table S3.
Table S4.
Table S5.
Table S6.
Table S7.