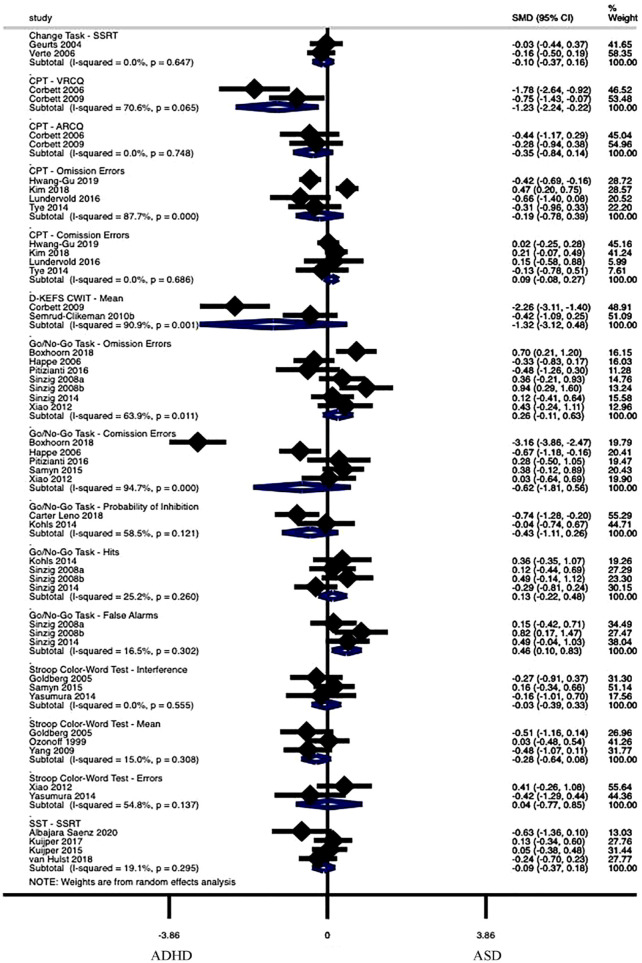
Figure 2.
Forest plot of response inhibition meta-analysis.
Note. Standardized Mean Difference (SMD) estimates are reported using Hedge’s g. I2 estimates are only relevant for analyses of five or more articles. Significance has been reached when the Subtotal does not cross 0. Positive values indicate greater scores in the ASD group. SSRT = stop signal response time; CPT = continuous performance test; VRCQ = visual response control quotient; ARCQ = auditory response control quotient; D-KEFS = Delis-Kaplan executive function system; CWIT = color-word interference test; SST = stop signal task.

