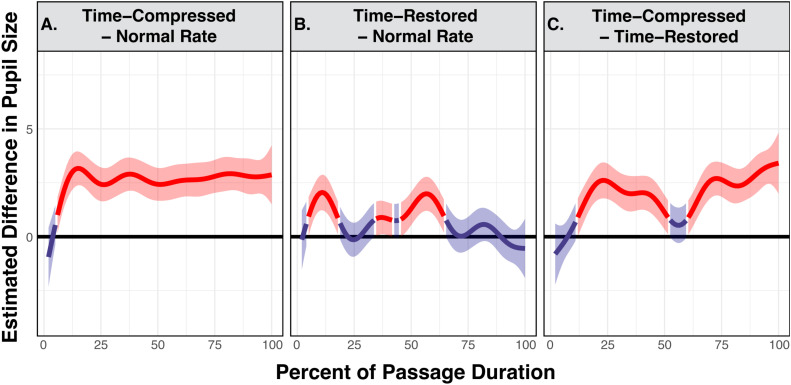
Figure 7.
Generalized additive mixed model predicted difference curves of adjusted pupillary responses when CI users listened to narrative passages. The top panels show contrasts in predicted pupil size between conditions of time-compression versus normal rate (A), time-restored versus normal rate (B), and time-compressed versus time-restored (C). A higher estimated difference is an indication of the greater difference between compared conditions, with regions highlighted in red indicating time points where there is a statistically significant difference. Shaded ribbons are 95% confidence intervals.

