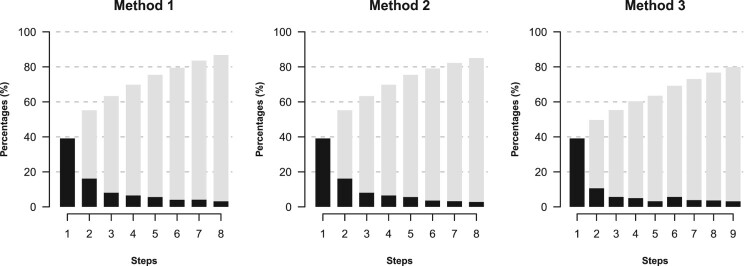
Figure 1.
Scree-type plots showing incremental amounts (black bars) at each step and cumulative amounts (gray bars) at each step of the three respective algorithms. The values are percentages of the maximum achievable deviance that can be accounted for by using a complete set of J−1 = 47 LRs in the logistic regression.

