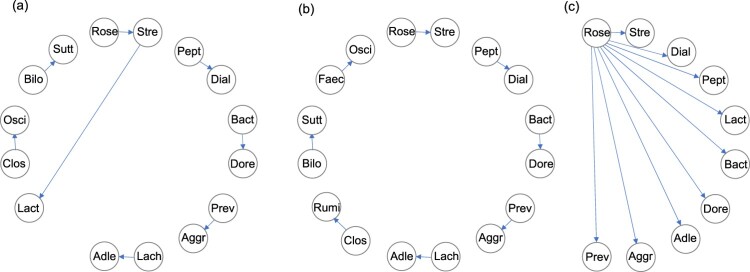
Figure 2.
Directed acyclic graphs (DAGs) visualizing the ratios selected in the three stepwise approaches (according to the Bonferroni penalty, the right-hand panels in Tables 1–3). Arrows point from the denominator to the numerator in every case. In each graph, the LR at the top (Stre/Rose) is the first one selected and the ratios introduced in the following steps are shown in a clockwise direction. (a) Unrestricted search, showing an overlap of Stre; 15 parts included. (b) Restricted to non-overlap; 16 parts included. (c) ALR selection; 10 parts included, which define a subcomposition, and the only graph out of the three that is connected.

