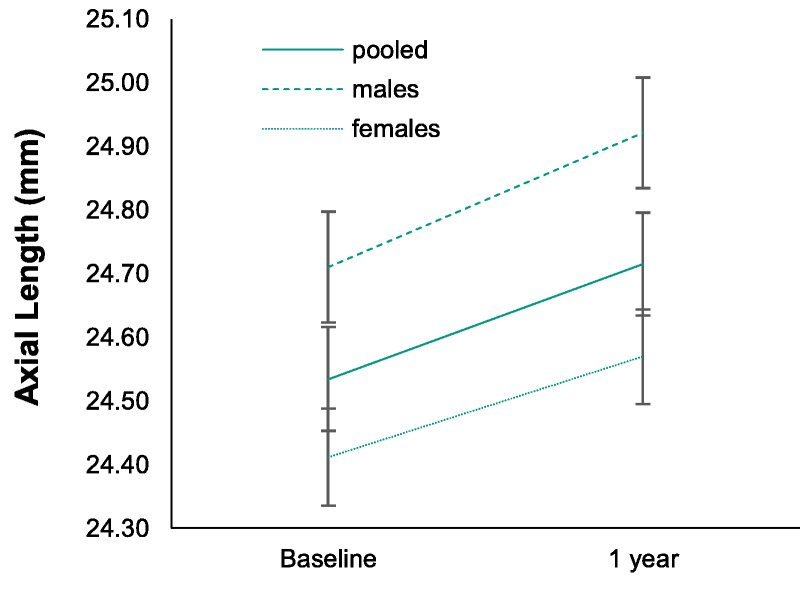
FIGURE 6.

Change in AL over the treatment period. The mean ALs for the total group, male patients, and female patients are plotted over time. The baseline ALs for male and female patients were significantly different at baseline, with male patients having longer baseline ALs than female patients. However, the rate of axial elongation was similar between male patients. Error bars represent the standard error of the mean. AL = axial length.
