
FIGURE 7.
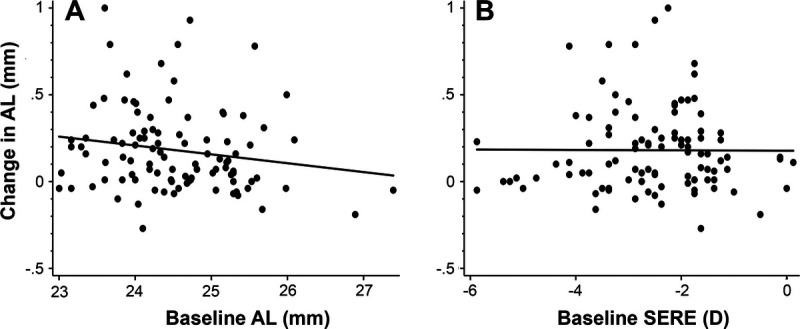
Change in AL during the first year of treatment compared with baseline AL and RE. (A) Change in AL versus baseline AL and (B) SE. AL = axial length; RE = refractive error; SE = spherical equivalent.
Official websites use .gov
A
.gov website belongs to an official
government organization in the United States.
Secure .gov websites use HTTPS
A lock (
) or https:// means you've safely
connected to the .gov website. Share sensitive
information only on official, secure websites.
Change in AL during the first year of treatment compared with baseline AL and RE. (A) Change in AL versus baseline AL and (B) SE. AL = axial length; RE = refractive error; SE = spherical equivalent.