FIGURE 8.

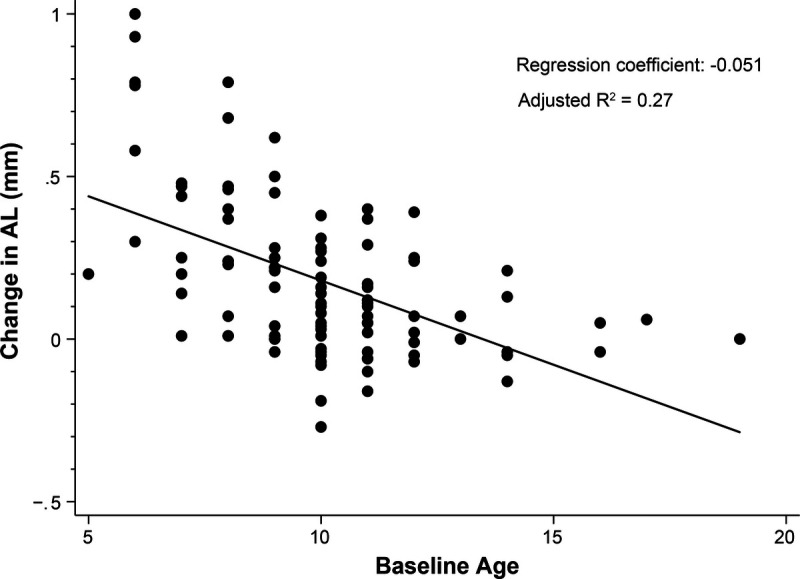
Change in AL during the first year of treatment versus baseline age. The change in AL was significantly related to the patients' age at baseline. AL = axial length.

Change in AL during the first year of treatment versus baseline age. The change in AL was significantly related to the patients' age at baseline. AL = axial length.