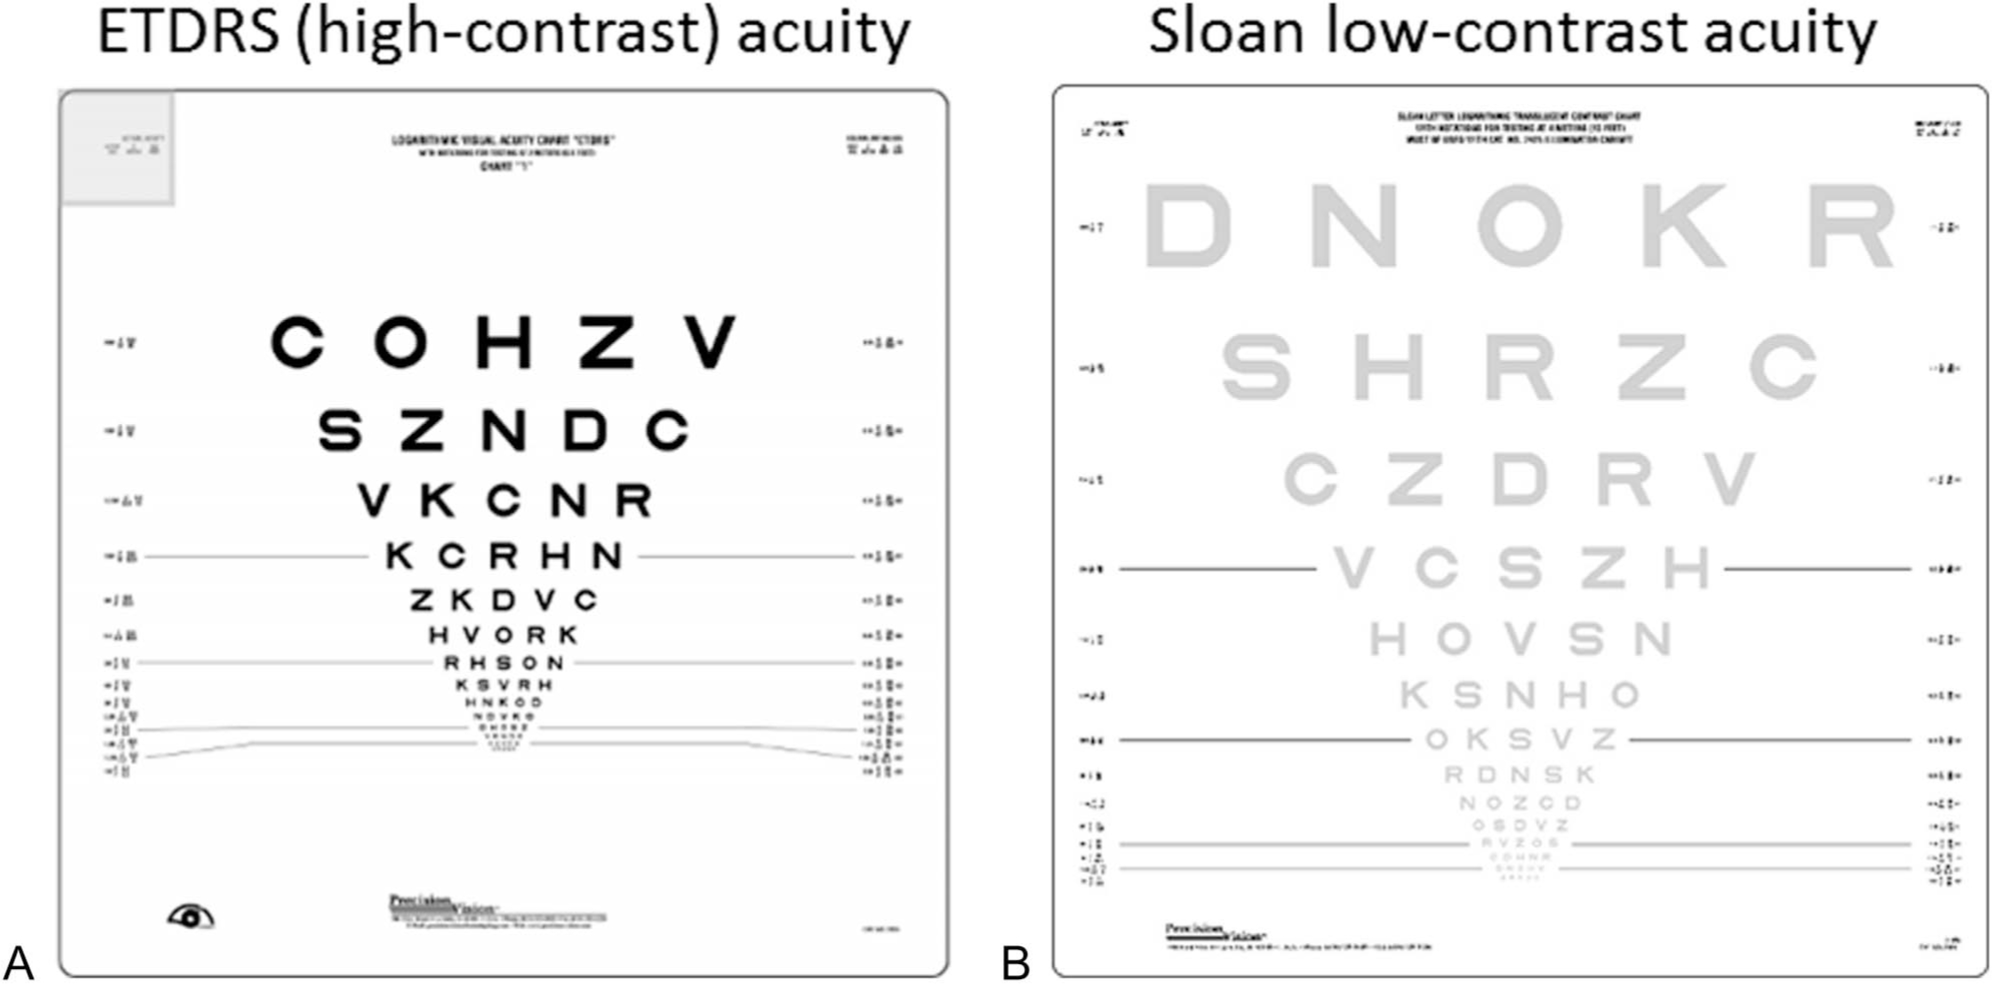
FIG. 1.

The visual acuity charts used include: (A) Early Treatment Diabetic Retinopathy Study (ETDRS) charts are high-contrast visual acuity charts and scored by the number of letters correctly identified (max 70 letters). B. Low-contrast letter acuity (LCLA) charts using 2.5% contrast; scoring is the same as for EDTRS charts. ETDRS and LCLA charts are typically administered at 2, 3, or 4 m using distinct charts calibrated for each distance. The 1.25% contrast charts (not pictured) are formatted similarly.
