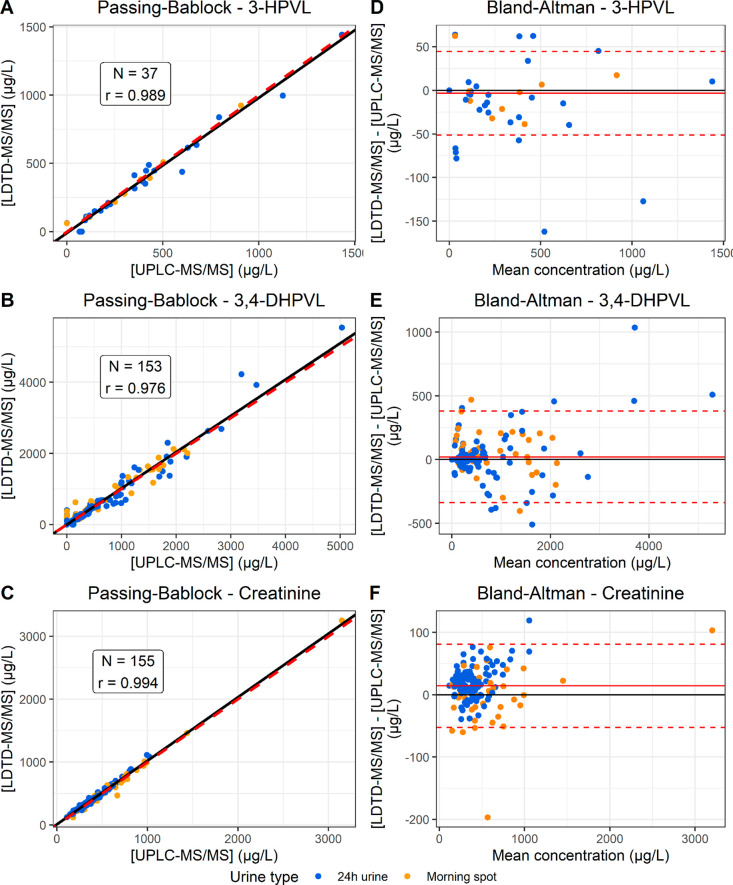
Figure 3.
Cross-validation by Passing–Bablock regression and Bland–Altman plots. Passing–Bablock regression plots for 3-HPVL (A), 3,4-DHPVL (B) and creatinine (C) and Bland–Altman for 3-HPVL (D), 3,4-DHPVL (E) and creatinine (F) are presented. Each sample is represented by a point of the graph. For the Passing–Bablock plots, the red dashed line represents [LDTD] = [LC] (y = x) and the black line represents the calculated Passing–Bablock regression line. For the Bland–Altman plots, the red full line represents the mean measurement difference, while the red dashed lines represents the mean measurement difference ±2 × standard deviation.

