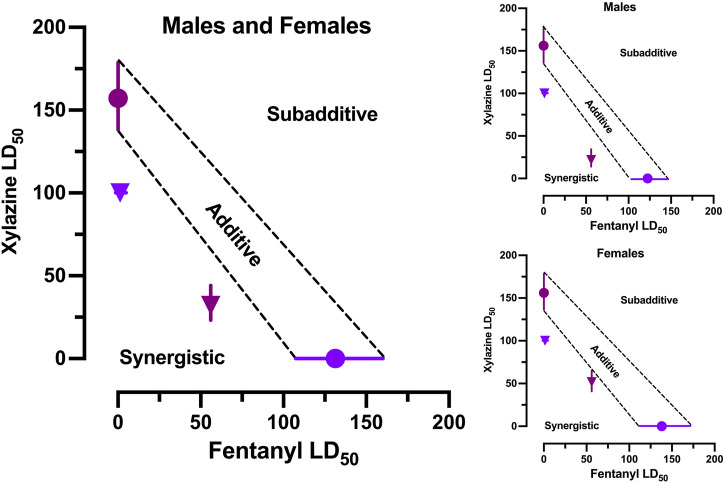
FIGURE 3.
Isobolographic analysis of fentanyl-xylazine interactions. Left: Isobologram derived from male and female mice in Figures 1, 2. Points reflects LD50 (±95% CL) of xylazine alone (plum circle), fentanyl alone (grape circle), 56 fentanyl + xylazine (plum triangle), and 100 xylazine + fentanyl (grape triangle). Points falling below the line of additivity (±95% CL) reflect synergistic interactions; points falling above the line of additivity reflect subadditive interactions. Both combinations of fentanyl and xylazine interacted synergistically. Upper Right: Isobologram derived from male mice in Figures 1, 2. Lower Right: Isobologram derived from female mice in Figures 1, 2.

