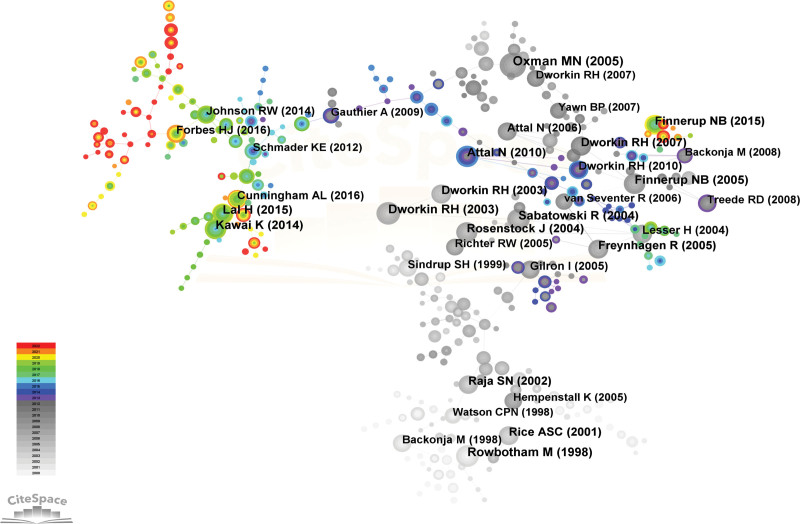
Figure 12.
Network map of references from Citespace. Each node represents a citation and the size of the node presents the number of that citation. The thickness of the lines indicates the intensity of the relationship between the regions/countries, which are represented by the connections between the nodes. The gray ring in the inner circle represents publications from the earliest year, while the red ring in the outer circle represents publications from the most recent year.

