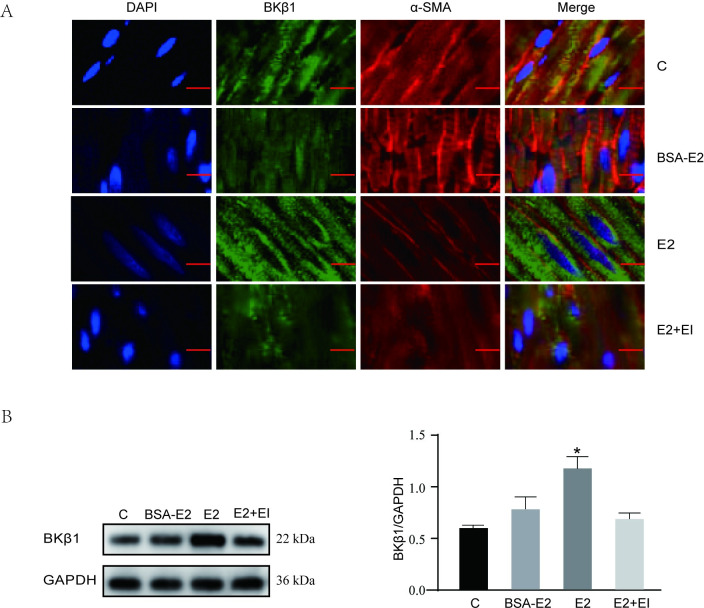
Fig 2. BKβ1 expression and distribution in rat colonic smooth muscle.
A Representative double immunofluorescence image showing BKβ1 expression (green) and α-SMA (red) in four groups (n = 6 each) of colonic smooth muscle (immunofluorescence double labeling, ×200). Scale bar = 10 μm. B Left panel: BKβ1 protein expression as showed by western blotting in four groups; right panel: quantification of BKβ1 protein levels normalized to GAPDH, n = 6. All data are displayed as mean ± SEM. *P < 0.05 when compared with C, BSA-E2 and EI groups.

