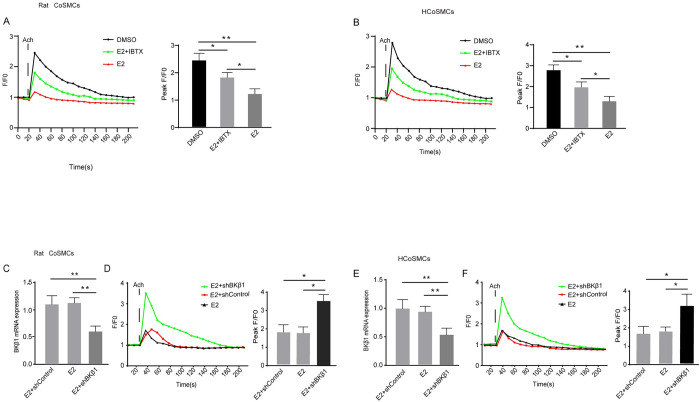
Fig 5. Evaluation of the effect of E2 on [Ca2+]i mobilization in SMCs after Ach stimulation.
A Changes in fluorescence intensity due to [Ca2+]i relative to the baseline (F/F0) in rat CoSMCs treated with DMSO, E2 + IBTX, or E2. Left panel: fluorescence intensity of [Ca2+]i; right panel: quantitative analysis of peak F/F0 and representative image of fluorescence at peak F/F0 from three independent experiments (n = 3). B Changes in fluorescence intensity due to [Ca2+]i relative to the baseline (F/F0) in HCoSMCs treated with DMSO, E2 + IBTX, or E2. Left panel: fluorescence intensity of [Ca2+]i; right panel: quantitative analysis of peak F/F0 and representative image of fluorescence at peak F/F0 from three independent experiments (n = 3). F0 was derived from the average intensity of the first 0–20 s. C BKβ1 mRNA levels in rat CoSMCs after transfection with BKβ1 shRNA for 48 h (n = 3). D Changes in fluorescence intensity due to [Ca2+]i relative to the baseline (F/F0) in rat CoSMCs treated with BK β1-subunit knockdown. Left panel: fluorescence intensity of [Ca2+]i; right panel: quantitative analysis of peak F/F0. F0 was derived from the average intensity of the first 0–30 s. E BKβ1 mRNA levels in HCoSMCs after transfection with BKβ1 shRNA for 48 h (n = 3). F Changes in fluorescence intensity due to [Ca2+]i relative to the baseline (F/F0) in HCoSMCs treated with BK β1-subunit knockdown. Left panel: fluorescence intensity of [Ca2+]i; right panel: quantitative analysis of peak F/F0. All data are displayed as mean ± SEM. *P < 0.05 and **P < 0.01.

