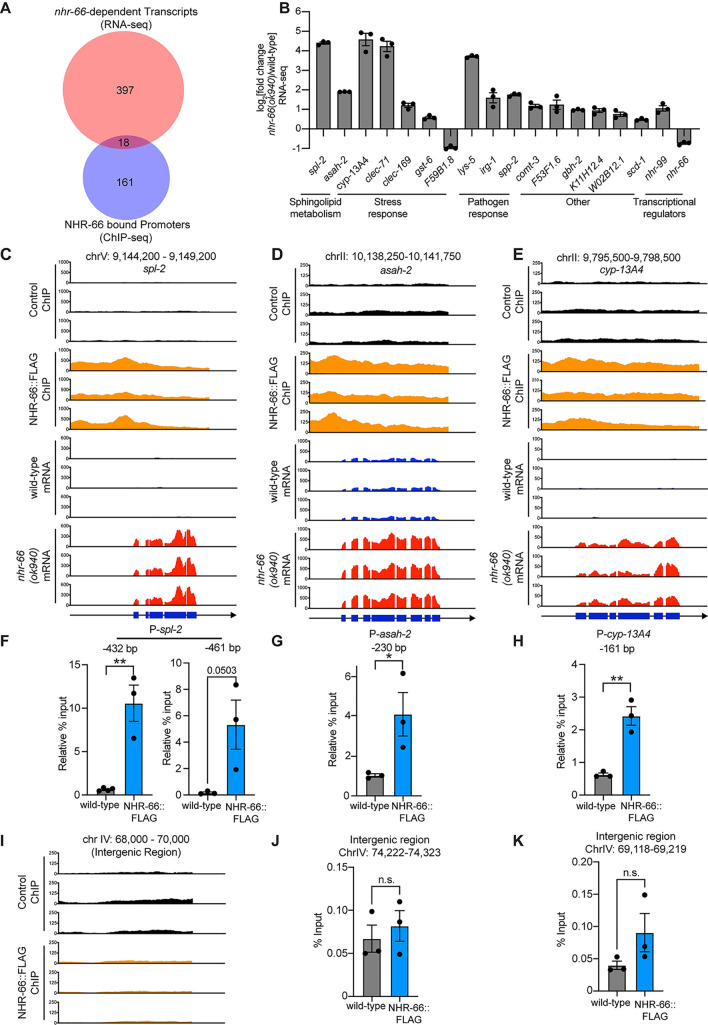
Fig 2. NHR-66 is a transcriptional repressor that directly targets stress response and sphingolipid metabolism genes.
A. Venn diagram showing the overlap between the genes whose promoters were bound by NHR-66::FLAG in the ChIP-seq experiment and the genes that are differentially regulated in nhr-66(ok940) mutants compared to wild-type (from the RNA-seq experiment). The overlap between these datasets is significant (hypergeometric p-value = 1.42 x 10⁻³). For both the RNA-seq and ChIP-seq experiments, n = 3 biological replicates, q<0.01. B. Fold change in expression of the 18 direct target genes of NHR-66 in nhr-66(ok940) mutants compared to wild-type animals is shown from the RNA-seq data. n = 3 biological replicates, q<0.01. C–E. ChIP-seq and mRNA-seq profiles from each of the three biological replicates are presented for spl-2 (C), asah-2 (D), and cyp-13A4 (E). The y-axis is the number of reads (log2). A gene model shows the location of the exons (blue) of the indicated genes. F and G. ChIP-PCR, performed to confirm the ChIP-seq data, is shown. The % input relative to the abundance of a random intergenic region of chromosome IV is presented for the promoter regions of spl-2 (F) (two different regions are shown), asah-2 (G) and cyp-13A4 (H) (locations are indicated relative to the start codon of the gene). ChIP-seq profiles (I) and ChIP-PCR data (J and K) are shown for random intergenic regions on chromosome IV, as described above. For the ChIP-PCR data in this figure, n = 3 biological replicates, *p<0.05 and ** p<0.01 (Student’s unpaired t-test). Source data for this figure is in S6 Table. See also S2 Table for the RNA-seq data, S3 Table for the ChIP-seq data, and S2 Fig.

