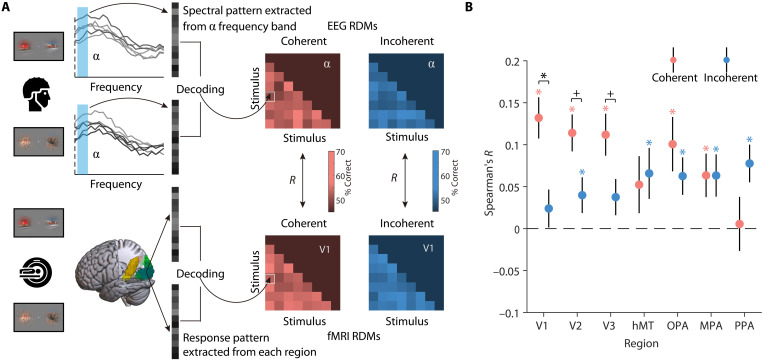
Fig. 4. EEG-fMRI fusion analysis.
(A) For each condition, EEG representational dissimilarity matrices (RDMs) for each frequency band (alpha, beta, and gamma) and fMRI RDMs for each ROI (V1, V2, V3, hMT, OPA, MPA, and PPA) were first obtained using pairwise decoding analyses. To assess correspondences between spectral and regional representations, we calculated Spearman correlations between the participant-specific EEG RDMs in each frequency band and the group-averaged fMRI RDMs in each region, separately for each condition. (B) Results of EEG-fMRI fusion analysis in the alpha band. Representations in the alpha band corresponded more strongly with representations in V1 (with a similar trend in V2 and V3) when the videos were presented coherently, rather than incoherently. No correspondences were found between the beta and gamma bands and regional activity (see fig. S9). Error bars represent SEs. *P < 0.05 (FDR-corrected), +P < 0.05 (uncorrected).

