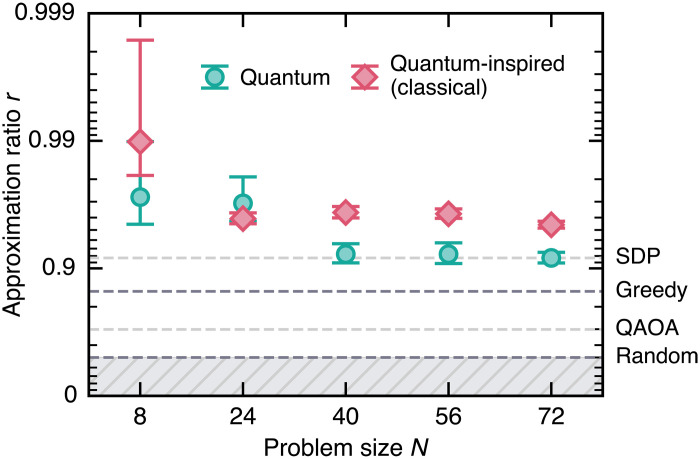
Fig. 3. Performance boost.
Approximation ratio based on different bit string generators: The hardware-run QAOA of Fig. 2, averaged over 10 problem instances, and quantum-inspired classical tensor network simulations (see Methods), averaged over 100 random SK problem instances. The different horizontal dashed lines correspond to the average performance of various algorithms in the limit N → + ∞. From bottom to top: Random sampling r = 1/2, a perfectly executed single-layer, nontruncated, QAOA circuit (29), the classical greedy baseline (see Methods), a classical SDP approach r = 1/2 + 1/πP ≃ 0.917090… (41–43) where P is the Parisi constant (39, 40). Error bars indicate 1 standard deviation. Numerical values are tabulated in the Supplementary Materials.

