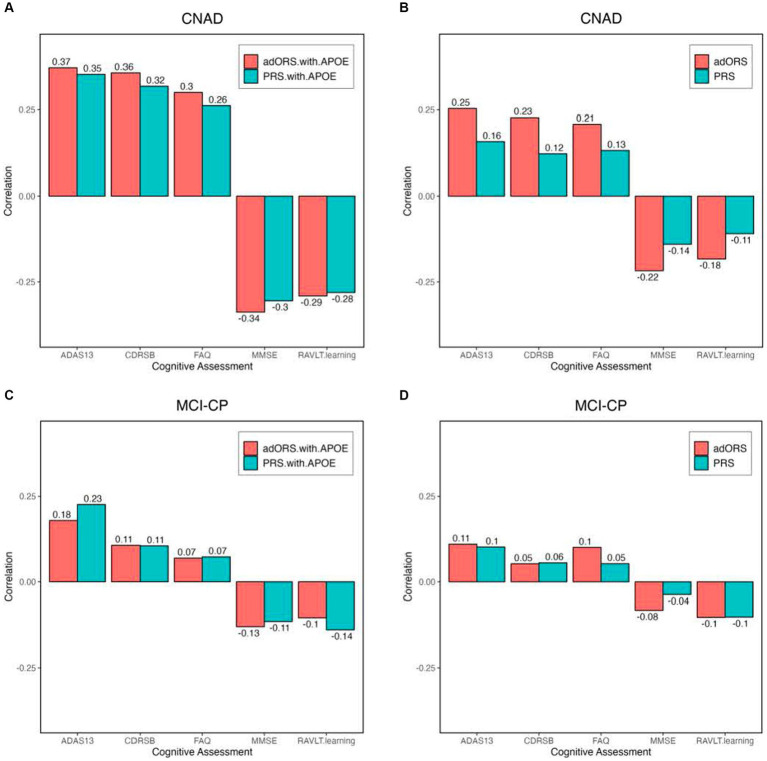
Figure 3.
PRS, PRS.with.APOE, adORS, and adORS.with.APOE associations with major AD clinical assessments of cognitive functions. Bar plots of Pearson correlations between each risk score (adORS: red, PRS: blue) and cognitive assessments in the entire cohort. Results are shown for the following tasks: CN vs. AD classification (A and B) and MCI conversion prediction (C and D). CNAD, CN vs. AD classification; MCI-CP, MCI conversion prediction; ADAS 13, Alzheimer’s disease assessment scale-cognitive subscale 13; CDRSB, Clinical dementia rating scale-sum of boxes; RAVLT, Rey auditory verbal learning test; MMSE, Mini mental state examination; and FAQ, Functional activities questionnaire.

