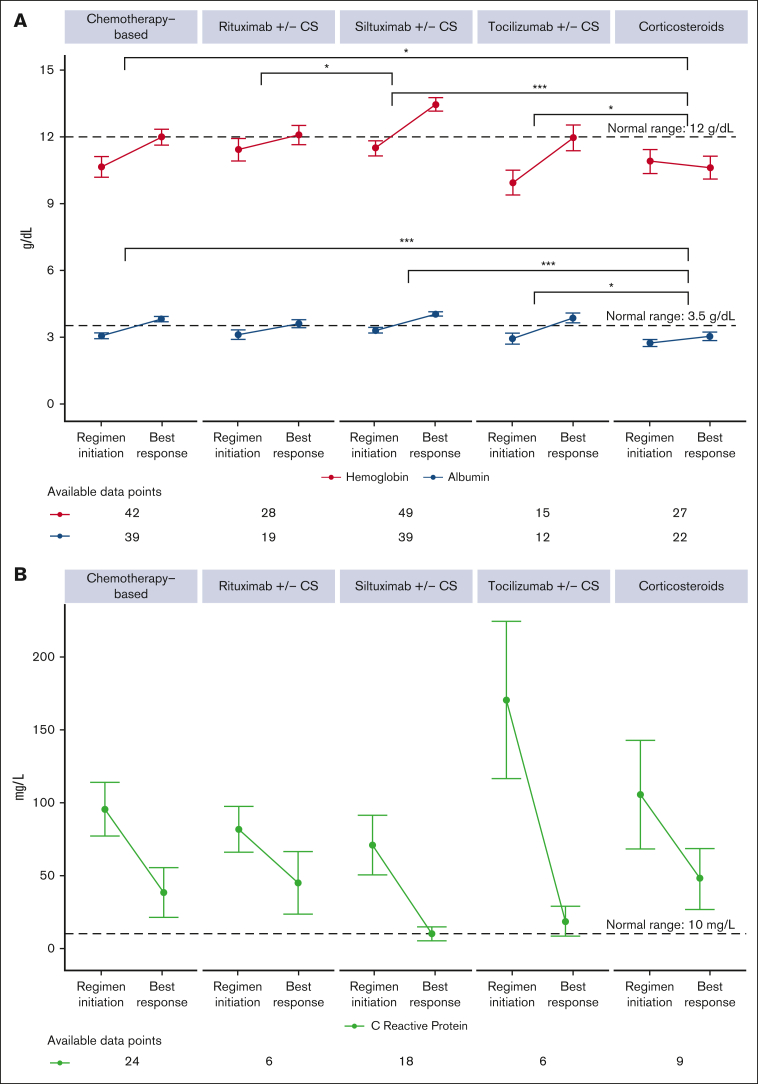
Figure 4.
Laboratory parameters indicate that some regimen categories outperform others. Mean and standard error of (A) hemoglobin (red) and albumin (blue) and (B) CRP at the initiation of a given regimen category (closest value within ± 7 days) and at the time of best response (closest value within ± 7 days). Anti-IL6–directed therapies show the most dramatic improvements in laboratory parameters, whereas corticosteroids show limited improvement. Slope between time points shown; available data points contributing to plots provided below plots. Only statistically significant results are marked, and statistical significance is defined by the number of asterisks: ∗P ≤ .05, ∗∗P ≤ .01, ∗∗∗P ≤ .001, and ∗∗∗∗P < .00001.

