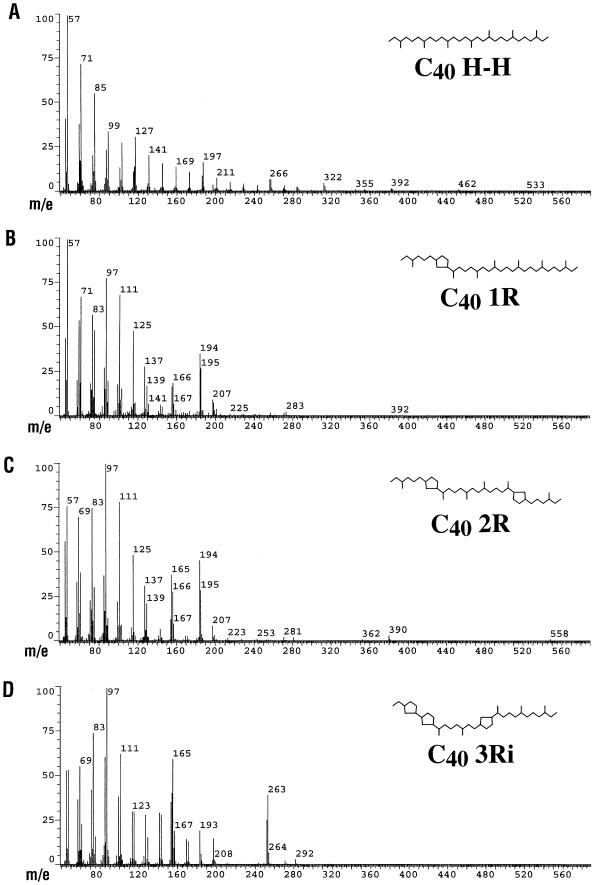
FIG. 3.
Mass spectra of the four identified caldarchaeol derivatives that were common to all samples analyzed. Lipids were extracted, derivatized, and analyzed as described in the text. The mass spectra are derived from the Antarctic picoplankton lipid sample used for the GC trace in Fig. 2. R, pentacyclic ring; i, isomer.

