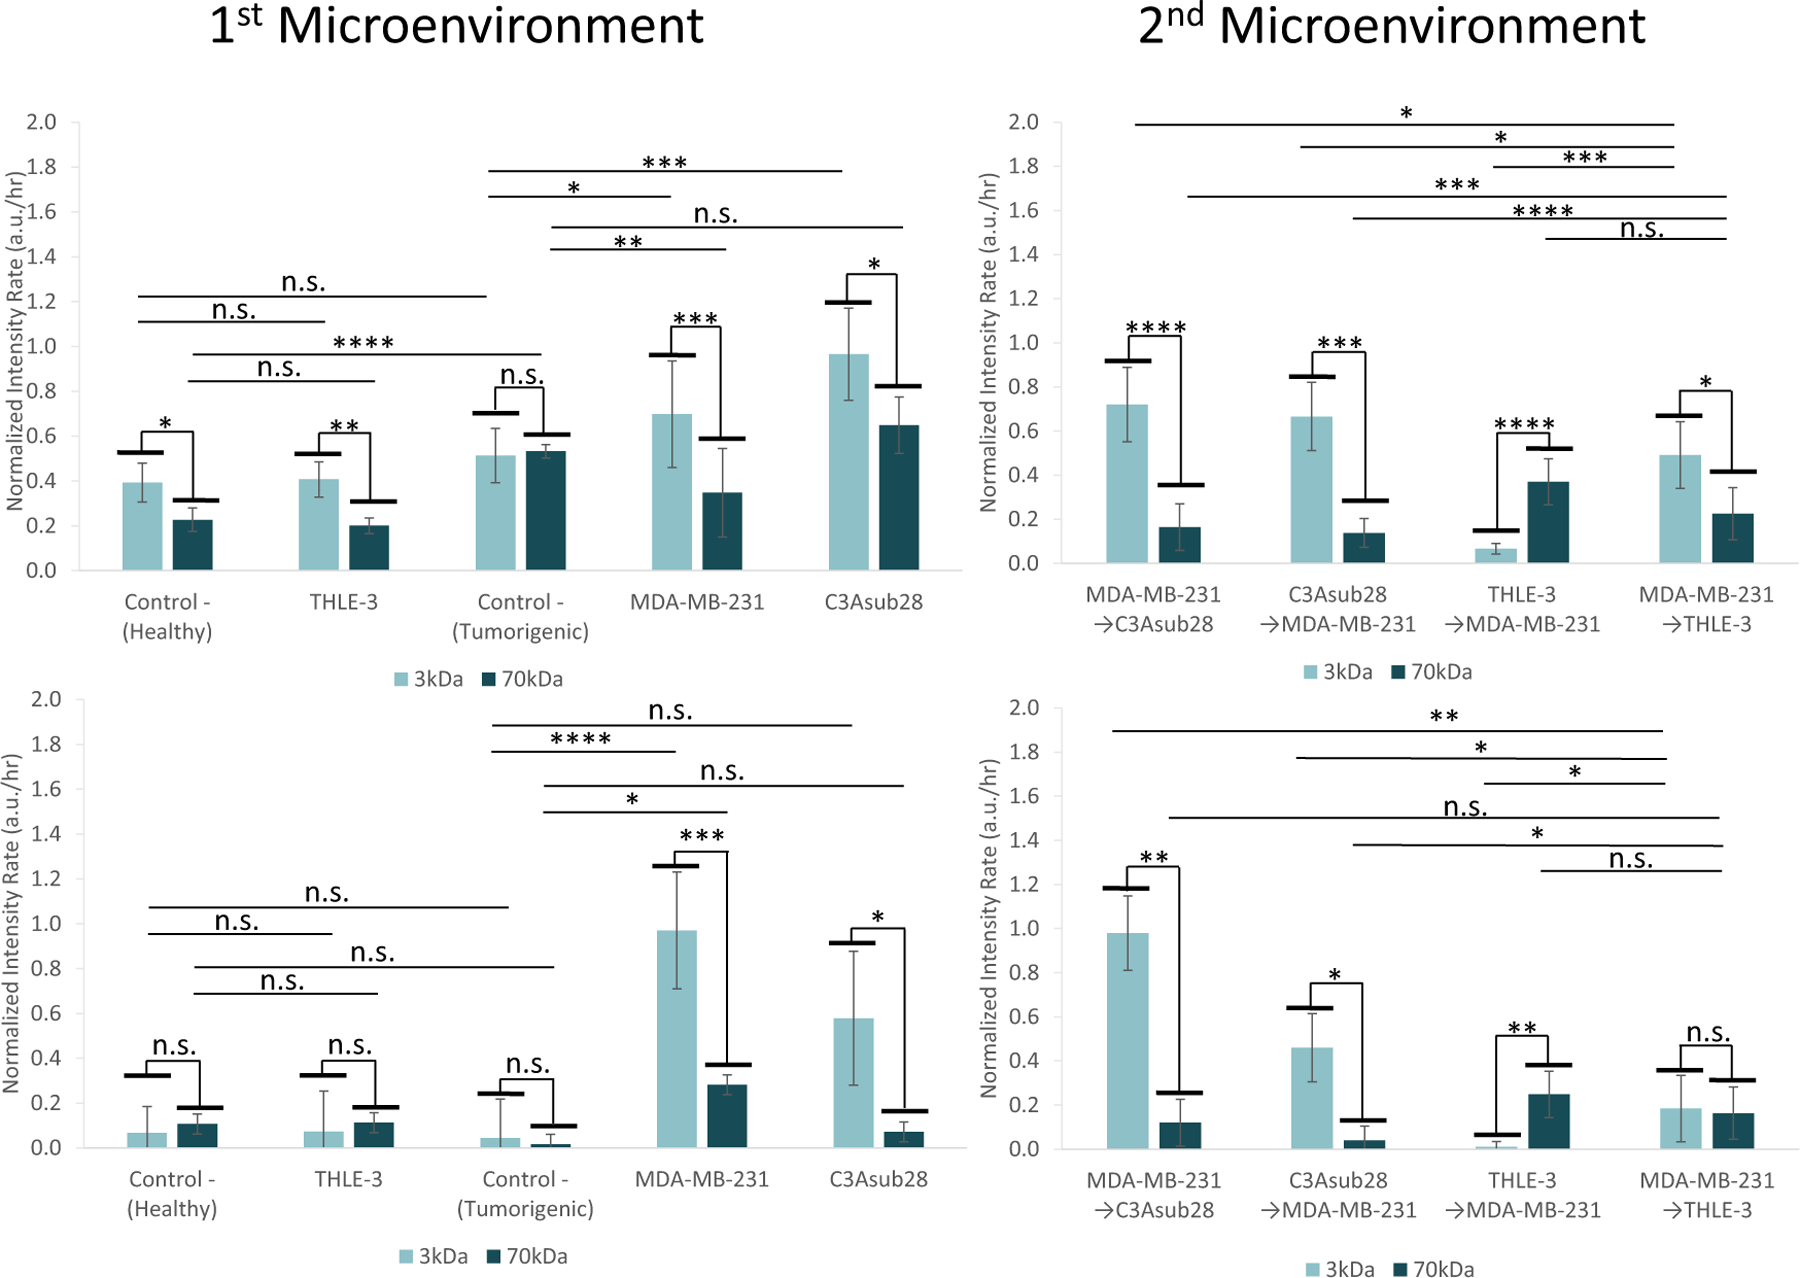
FIGURE 10.

Accumulation rate in vessel and ECM in response to different sequences of perfusion in the tissue microenvironments. First microenvironment accumulation rates in the (a) ECM and (b) vessel for THLE-3, MDA-MB-231, and C3Asub28 and their corresponding control microenvironments. Second microenvironment accumulation rate in the (c) ECM and (d) vessel for MDA-MB-231, C3Asub28, and THLE-3 microenvironment interactions when particles are introduced to either the healthy or tumorigenic platforms first. Microenvironment perfusion sequence order was applied as described in the figure. Control− (Tumorigenic) refers to TIME monoculture with the collagen concentration of 7 mg/ml, 711μm vessel diameter, and exposed to 1 dyn/cm2 wall shear stress. Control− (Healthy) refers to TIME monoculture with the collagen concentration of 4 mg/ml, 435μm vessel diameter, and exposed to 4 dyn/cm2 wall shear stress. Data shown are mean ± SD. n = 4;∗P < 0.05, ∗∗P < 0.01; ∗∗∗P < 0.005, ∗∗∗∗P < 0.001. ns: not significant. ECM: extracellular matrix; TIME: telomerase-immortalized microvascular endothelial [Color figure can be viewed at wileyonlinelibrary.com]
