
FIGURE 5.
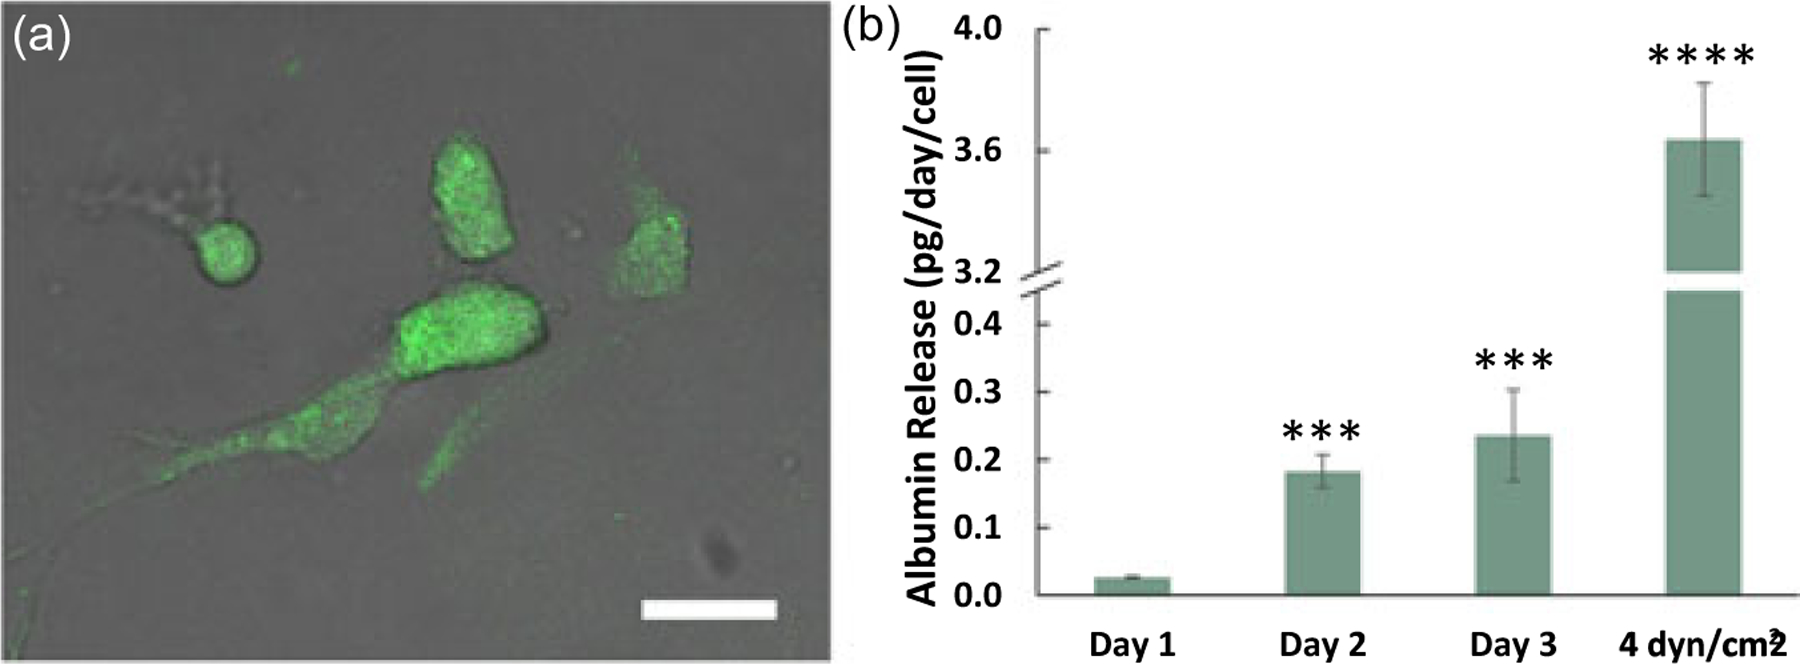
Albumin expression and release from healthy liver cells within THLE-3/TIME vascularized microenvironments. (a) FITC-tagged anti-albumin immunostained healthy liver cells overlaid with bright field image. Scale bar is 10 μm, (b) Albumin release from THLE-3/TIME vascularized microenvironment during Days 1, 2, and 3 (the preconditioning period), and then under physiological wall shear stress after the preconditioning period. Statistical significance was compared with Day 1. Data shown are mean ± SD. n = 5;∗∗∗P < 0.005, ∗∗∗∗P < 0.001 [Color figure can be viewed at wileyonlinelibrary.com]