
FIGURE 9.
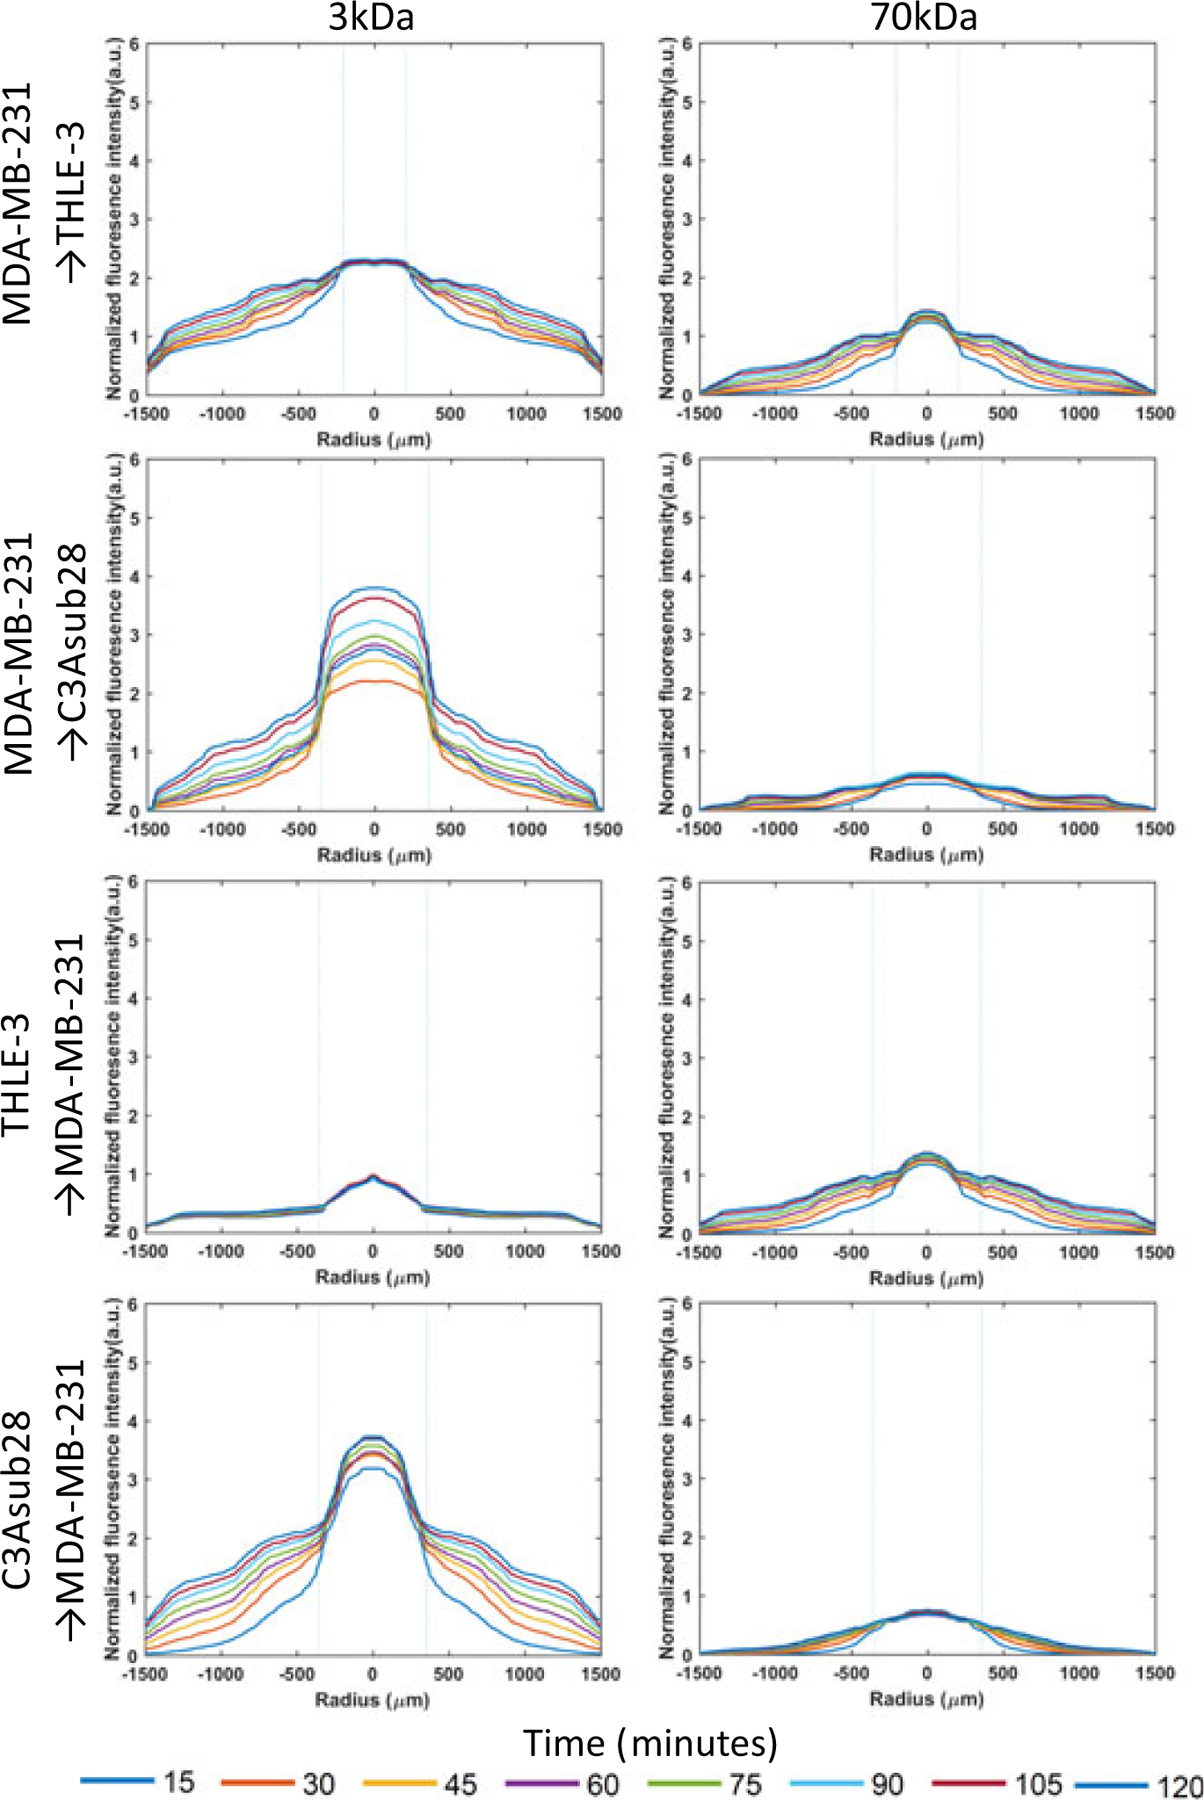
Diffusion curves of fluorescent dextran particles (3 and 70 kDa) with respect to time and position across ECM boundaries for secondary compartments of the tumorigenic breast (MDA-MB-231) and liver (C3Asub28), and healthy liver (THLE-3) microenvironments. Control− (Tumorigenic) refers to TIME monoculture with the collagen concentration of 7 mg/ml, 711μm vessel diameter, and exposed to 1 dyn/cm2 wall shear stress. Control− (Healthy) refers to TIME monoculture with the collagen concentration of 4 mg/ml, 435μm vessel diameter, and exposed to 4 dyn/cm2 wall shear stress. Dashed lines represent vessel boundaries. The microenvironment sequence order of nanoparticle circulation is presented as in the figure. Fluorescence intensity profiles of three experiments were averaged(n = 3). ECM: extracellular matrix; TIME: telomerase-immortalized microvascular endothelial [Color figure can be viewed at wileyonlinelibrary.com]