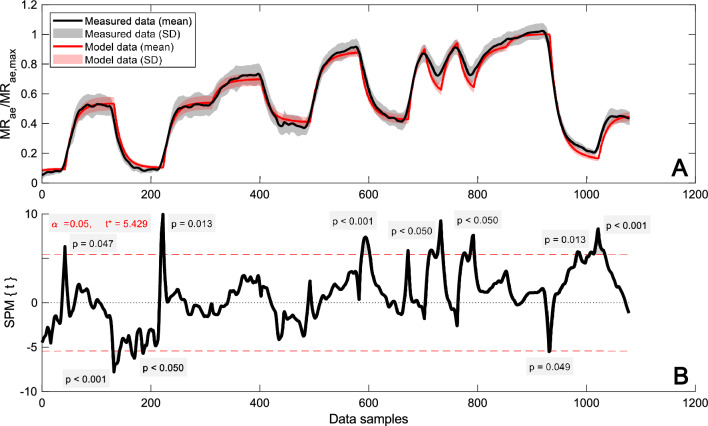
Fig. 6.
Time resolved mean and SD (Panel A) and statistical parametric mapping from the two-tailed paired t-test (Panel B) of measured and modeled individual MRae normalized with MRae,max for P3 (n = 11). Results from three subjects are omitted due to deviations in duration during one or more periods (same subjects as in Fig. 5). Data for the period leading to volitional exhaustion has been stretched/squeezed to allow comparison across the subjects. The dashed lines show the critical t-value, indicating the limit for significant differences (p < 0.05) between measured and modeled data

