
Fig. 1.
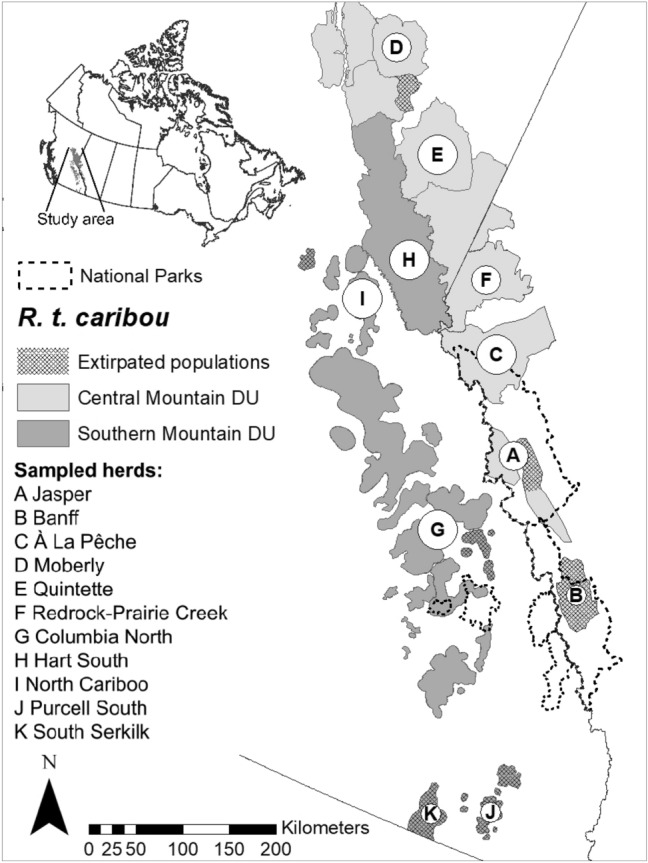
Caribou sampled in the southern Rocky Mountains of Canada for genomic analyses (n = 137; sampling locations in Fig. 3). Black lettered circles indicate sampled herds (i.e., a term used to indicate subpopulations, although herds of Woodland caribou are not social groups) with circle size proportional to sample size (mean = 12.45, SD = 7.03, range 2–20). Grey-scale polygons show the distribution of Designatable Units (DUs) encompassing multiple herds