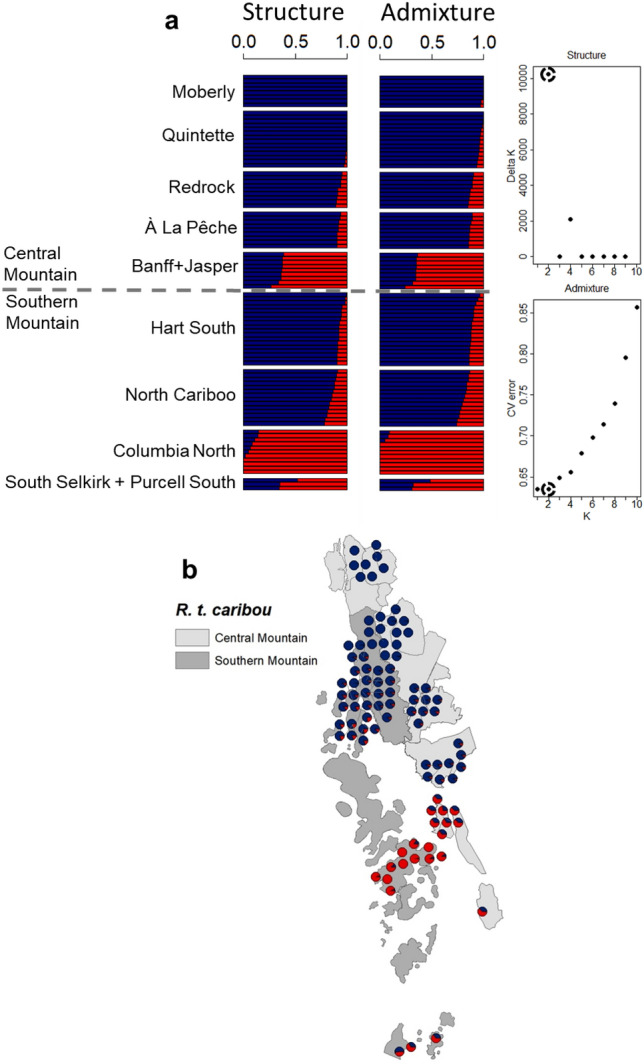
Fig. 4.

Population structure of caribou sampled in the southern Rocky Mountains of Canada. a Bar plots from STRUCTURE and ADMIXTURE analyses indicate individual proportions of assignment into two main genetic clusters (red or blue color). The most likely number of clusters (K) obtained with STRUCTURE (higher values best) and ADMIXTURE (lower values best) is indicated with circles on the respective scatter plots. b Map showing distribution of sampled caribou (capture coordinates) with proportion of belonging to either cluster for each individual obtained with STRUCTURE (pie chart)
