Figure 6.
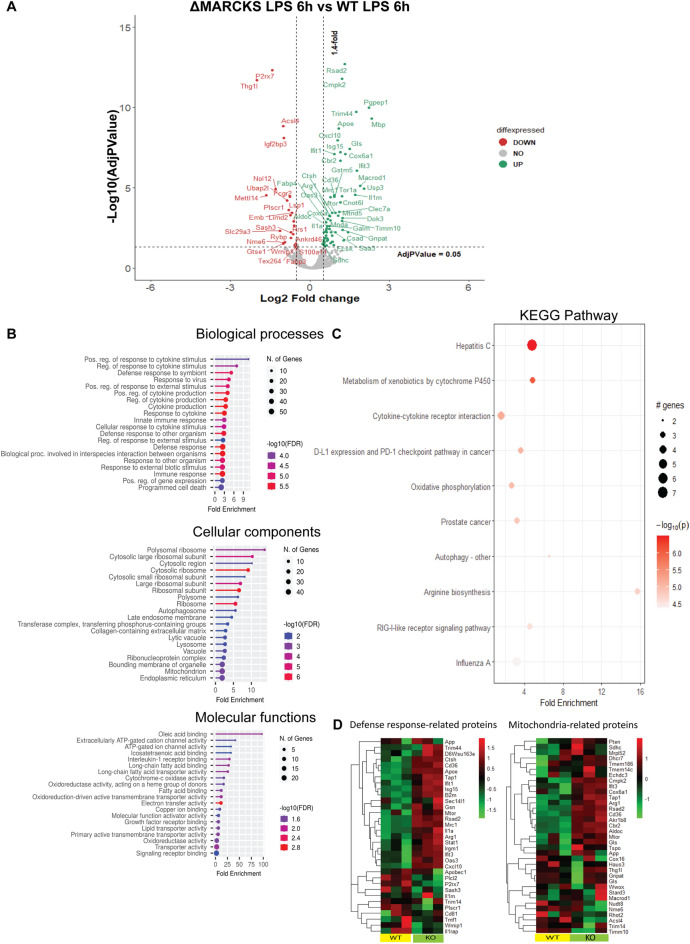
MARCKS-deficient macrophages show distinct proteome profiles after LPS stimulation. (A) Volcano plot for the differential protein expression after 6 h LPS stimulation between WT IMMs and ΔMARCKS IMMs. Green dots are representative of upregulated proteins and red dots are representative of downregulated proteins. (B) Go enrichment analysis was performed using shinyGO v 0.77 to characterize the biological functions including Biological Processes, Cellular Components and Molecular Functions of these differentially expressed proteins. (C) KEGG pathway enrichment analysis. The x axis represents the fold enrichment value while y axis represents the enrich pathway the size of bubble shows the number of differentially expressed proteins in the indicate pathway. The color indicates the − log10(lowest-p) value, the redder color, the more significantly pathway is enriched. (D) Heatmap plot of differentially expressed proteins involved in defense response related proteins and mitochondria related proteins comparing WT and ΔMARCKS IMMs.

