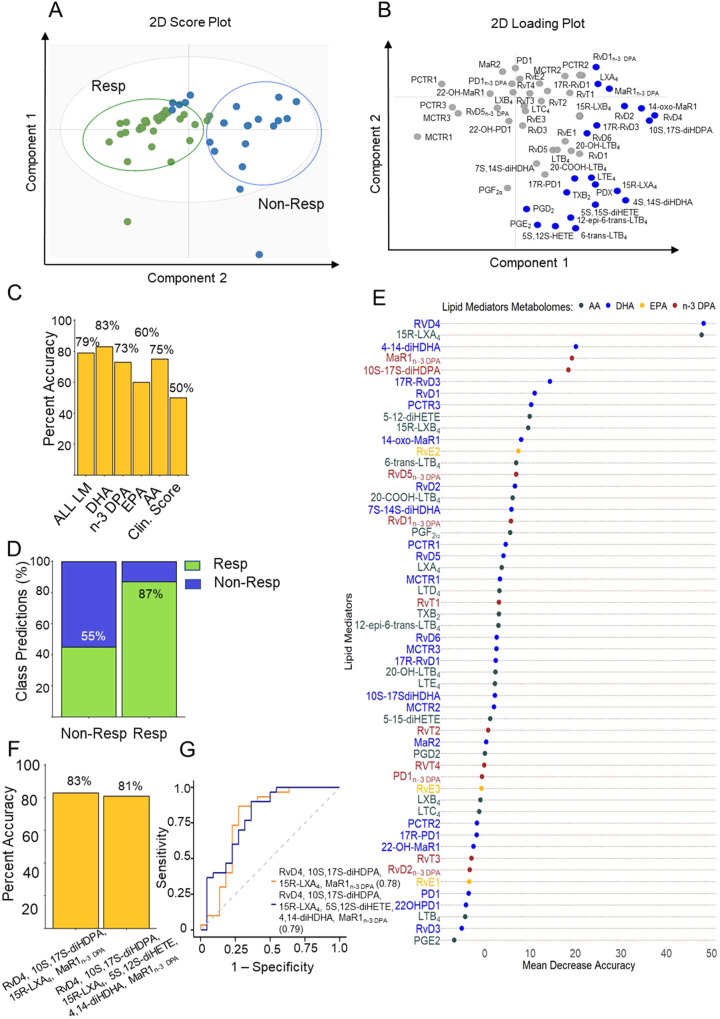
Fig. 1. Reanalysis of baseline plasma lipid mediator profiles supports their potential utility as biomarkers.
Plasma was collected from RA patients prior to the initiation of treatment with DMARDs and lipid mediator concentrations established using LC-MS/MS-based lipid mediator profiling (see Supplementary Methods for details). A, B OPLS-DA analysis of peripheral blood lipid mediator concentrations for DMARD responders (Resp) and DMARD non-Responders (Non-Resp). A Two-dimensional score plot with the gray circle representing the 95% confidence regions. B Two-dimensional loading plots. Lipid mediators with VIP score greater than 1 are highlighted in blue and upregulated in Non-Resp. Results are representative of n = 30 Resp and n = 22 Non-Resp. C Percentage accuracy score of prediction models based on the combination of all lipid mediators identified and quantified (AL LM) or individual fatty acid metabolomes as indicated. Clin. Score = clinical score (see methods from Gomez et al., for parameters included). D Classification predictions for each class (sensitivity and specificity) of the n-3 DPA model. Green indicates the samples that were predicted as Resp while blue indicates those patients predicted Non-Resp. Percentages indicate true positives (Resp class) and true negatives (Non-Resp class). E Relevance of lipid mediators in the prediction performance of the “ALL LM” model based on decreasing accuracy. F Percentage accuracy score of models using the indicated SPM. G Receiver operating characteristic (ROC) curves and AUC values for predictive models based on the indicated SPM. All the models were created using the random forest methodology (“randomForest” package from R).

