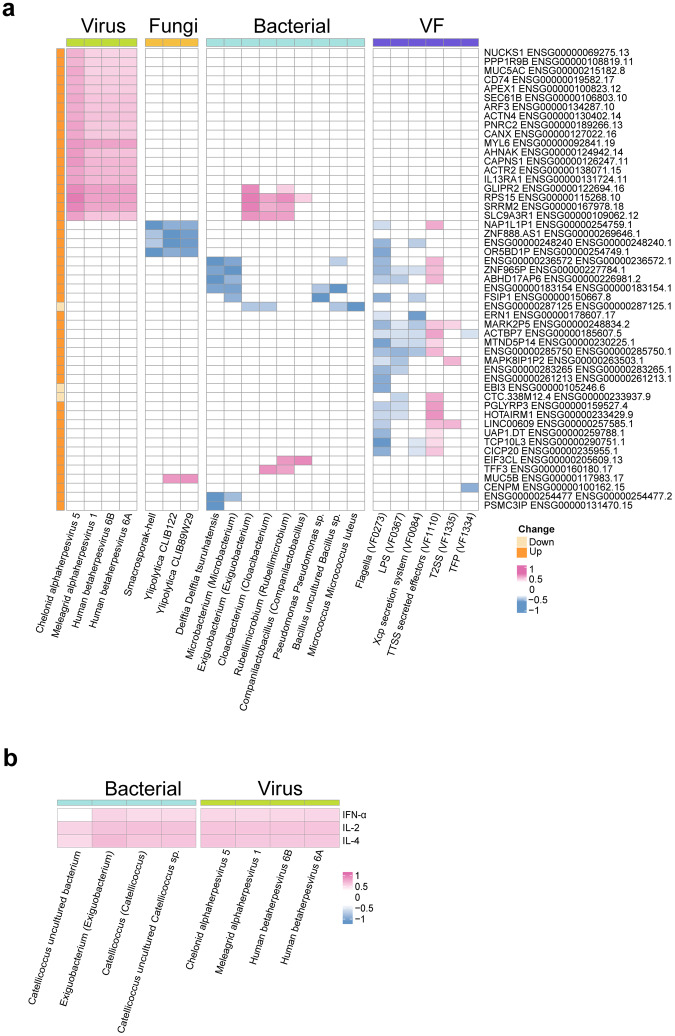
Fig. 4.
Multi-omics correlation analysis of COVID-19 patients. a Heatmaps display the correlation analysis of viral, fungal, bacterial, and virulence factor, with differentially expressed genes in COVID-19 patients. Spearman correlation coefficients with adjusted p-values < 0.05 are marked in colored cells. b Heatmaps depicting correlation analysis between differentially expressed genes of viral and bacterial with cytokine levels in invasive ventilated COVID-19 patients. Positions with adjusted p-values < 0.05 are shown in color code, and the Spearman correlation coefficient numbers are within each grid. Only absolute correlation coefficients greater than 0.5 are displayed. COVID-19 patients (n = 63)

