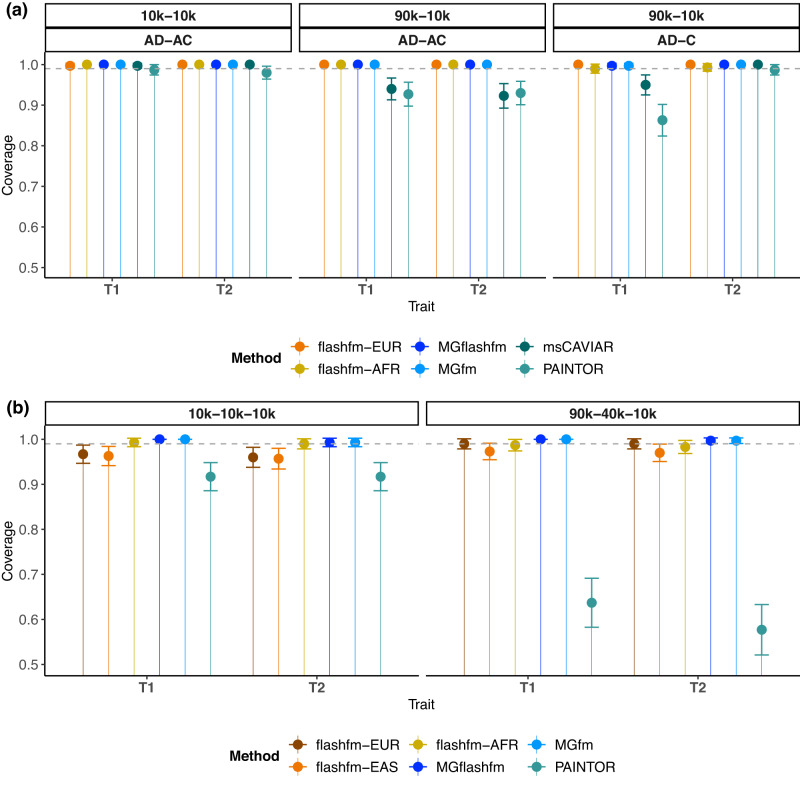
Fig. 2. Flashfm, MGflashfm and MGfm, are well-calibrated.
Coverage is measured as the probability that all causal variants are captured by the 99% credible set, estimated over 300 replications. Data are presented as the proportion of replications in which the 99% credible set contains all causal variants ± SEM, where SEM is the standard proportion error bound of a 95% confidence interval based on 300 observations. Flashfm-EUR, flashfm-EAS and flashfm-AFR are multi-trait (single-group) fine-mapping for the indicated group and are well-calibrated in all settings, as are MGflashfm and MGfm. PAINTOR and msCAVIAR are not well-calibrated for unequal sample sizes, though msCAVIAR is well-calibrated in the single causal variant setting. a Coverage results from EUR-AFR simulations. Within each panel the three simulation settings are shown as either having equal sample sizes of 10k each or sample sizes of 90k EUR and 10k AFR, and either two causal variants for each trait with one shared (trait 1: AD, trait 2: AC) or non-overlapping causal variants and one trait having a single causal variant (trait 1: AD, trait 2: C); any pair of causal variants have r2 < 0.5. b Coverage results from EUR-EAS-AFR simulations with equal sample sizes of 10k each or 90k EUR, 40k EAS, and 10k AFR. In both settings each trait has two causal variants (trait 1: AD, trait 2: AC). The A variant has 0.005 < MAF < 0.05 in EUR and EAS groups, but MAF > 0.05 in the AFR group, and the C and D variants have MAF > 0.05 in all groups.

