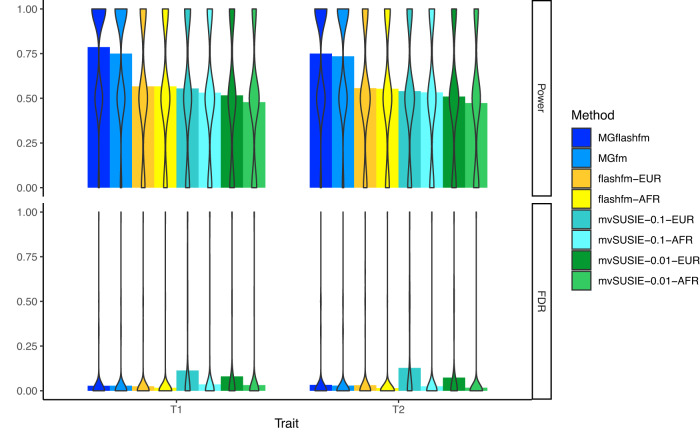
Fig. 4. MGflashfm has the highest power and low FDR.
For EUR-AFR simulations of two traits, results are summarised for sample sizes of 90k EUR and 10k AFR, where there are two causal variants for each trait with one shared (trait 1: AD, trait 2: AC); any pair of causal variants have r2 < 0.5 and there are 300 replications within each setting. The mean power and mean FDR are shown for each method, as indicated by the top of each bar; the distribution of the power and FDR estimates over the 300 replications is shown by violin plots, where width indicates frequency. Power and FDR for the flashfm family of methods are calculated using a MPP threshold of 0.9, and for mvSUSIE lfsr thresholds of 0.1 and 0.01 are used. The power is highest for MGflashfm, followed by MGfm, then the group-specific flashfm and mvSUSIE methods. FDR is relatively low and similar amongst all methods, though lowest for flashfm-AFR and highest for mvSUSIE-EUR.

