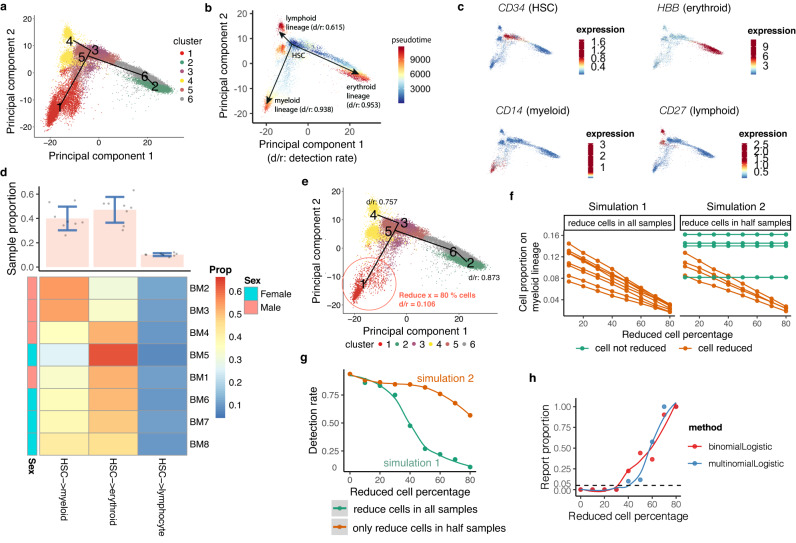
Fig. 2. Lamian estimates tree topology stability (Module 1) and tests differential tree topology between sexes (Module 2) in the HCA bone marrow data37,38.
a Inferred tree topology using eight integrated scRNA-seq bone marrow samples displayed in the first two principal components (PCs). Dots are cells colored by cluster labels (k = 6). b Similar to (a), but cells are colored by pseudotime. The estimated detection rates (d/r) are shown for three tree branches corresponding to three lineages of hematopoietic stem cell (HSC) differentiation. c Similar to (a), but cells are colored by the expression of lineage-specific marker genes. d Heatmap of sample-level branch cell proportion (Prop, the number of cells in each branch divided by the total number of cells in a sample). The barplot shows the mean (pink bar) ± SD (blue bars) of the branch cell proportion across n = 8 samples for each lineage. Cell proportions are displayed as dots and heatmap. e Tree topology and detection rates after randomly removing x = 80% cells on the myeloid lineage (branch 5 → 1) as an illustration of simulation. f Simulations are conducted by either removing certain percentage of cells (x-axis) along the myeloid lineage across all eight samples (simulation 1: left) or removing cells in only half of the samples (simulation 2: right). g Lamian-reported the detection rate of the myeloid lineage (y-axis) after removing different percentages of cells (x-axis) in simulations. h In simulation 2, the difference between the two sample groups increases as the reduced cell percentage x increases. For each x, 10,000 simulations were run. The proportion of Lamian differential topology test p-values (two-sided) smaller than the significance cutoff 0.05 in the simulations (y-axis) is shown as a function of the reduced cell percentage (x-axis). Source data are provided as a Source Data file.

