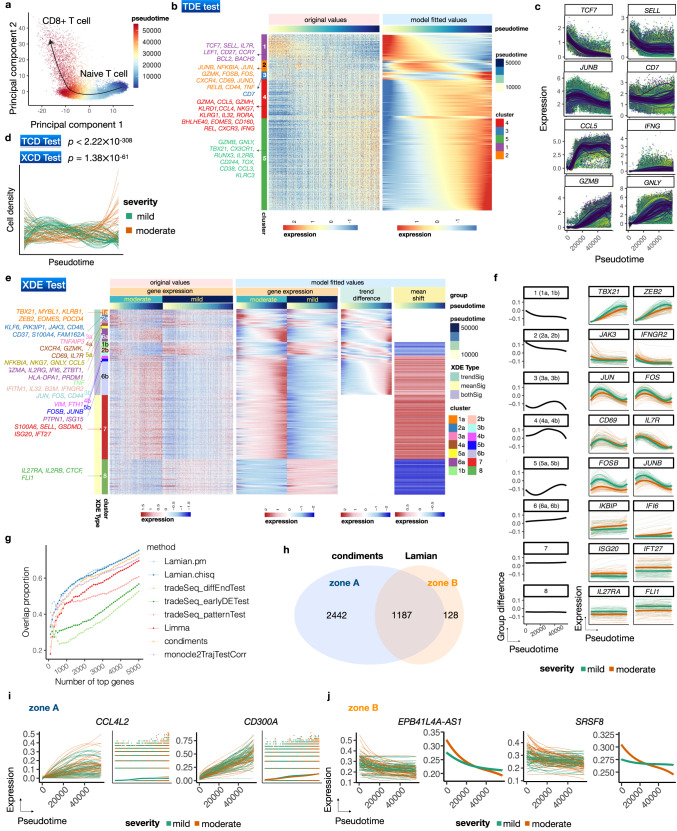
Fig. 5. Lamian analysis of COVID-19 samples identifies differential genes related to T-cell activation and inflammation between mild and moderate patients.
a Principal component plot of CD8+ T cells colored by pseudotime which reflects the T cell activation process. b Heatmap showing the original (left) and model-fitted (right) expression of TDE genes along the T cell activation pseudotime. c Example TDE genes from different TDE clusters shown in (b). Dots are cells. Curves are samples' pseudotemporal patterns fitted by Lamian. d Pseudotemporal pattern of the cell density for each sample represented by a curve. P-values (one-sided) of TCD and XCD tests indicate significant change along pseudotime and significant difference between mild and moderate samples (n = 114). e Heatmaps showing the pseudotemporal expression patterns of XDE genes (rows). Cells (columns) from moderate and mild patients are plotted separately and ordered by pseudotime. White bars are used to separate original temporal gene expression, model-fitted temporal gene expression, group trend difference (moderate group minus mild group), and group mean shift. Example genes related to immune and inflammation processes are marked. f Each XDE gene cluster in (e) is shown with the averaged group difference (left: black) and two example genes. For each example gene, the curves represent its pseudotemporal pattern for each sample. g Samples are randomly partitioned into two datasets. For each method, the proportion of top N XDE genes that overlap between the two datasets (y-axis) is shown as a function of N (x-axis). h A Venn diagram showing the number of XDE genes reported by condiments and Lamian. i–j Example genes that are reported only by condiments (i) or Lamian (j). Each gene has two plots: sample-level patterns, and group-level patterns fitted by the method. Source data are provided as a Source Data file.

