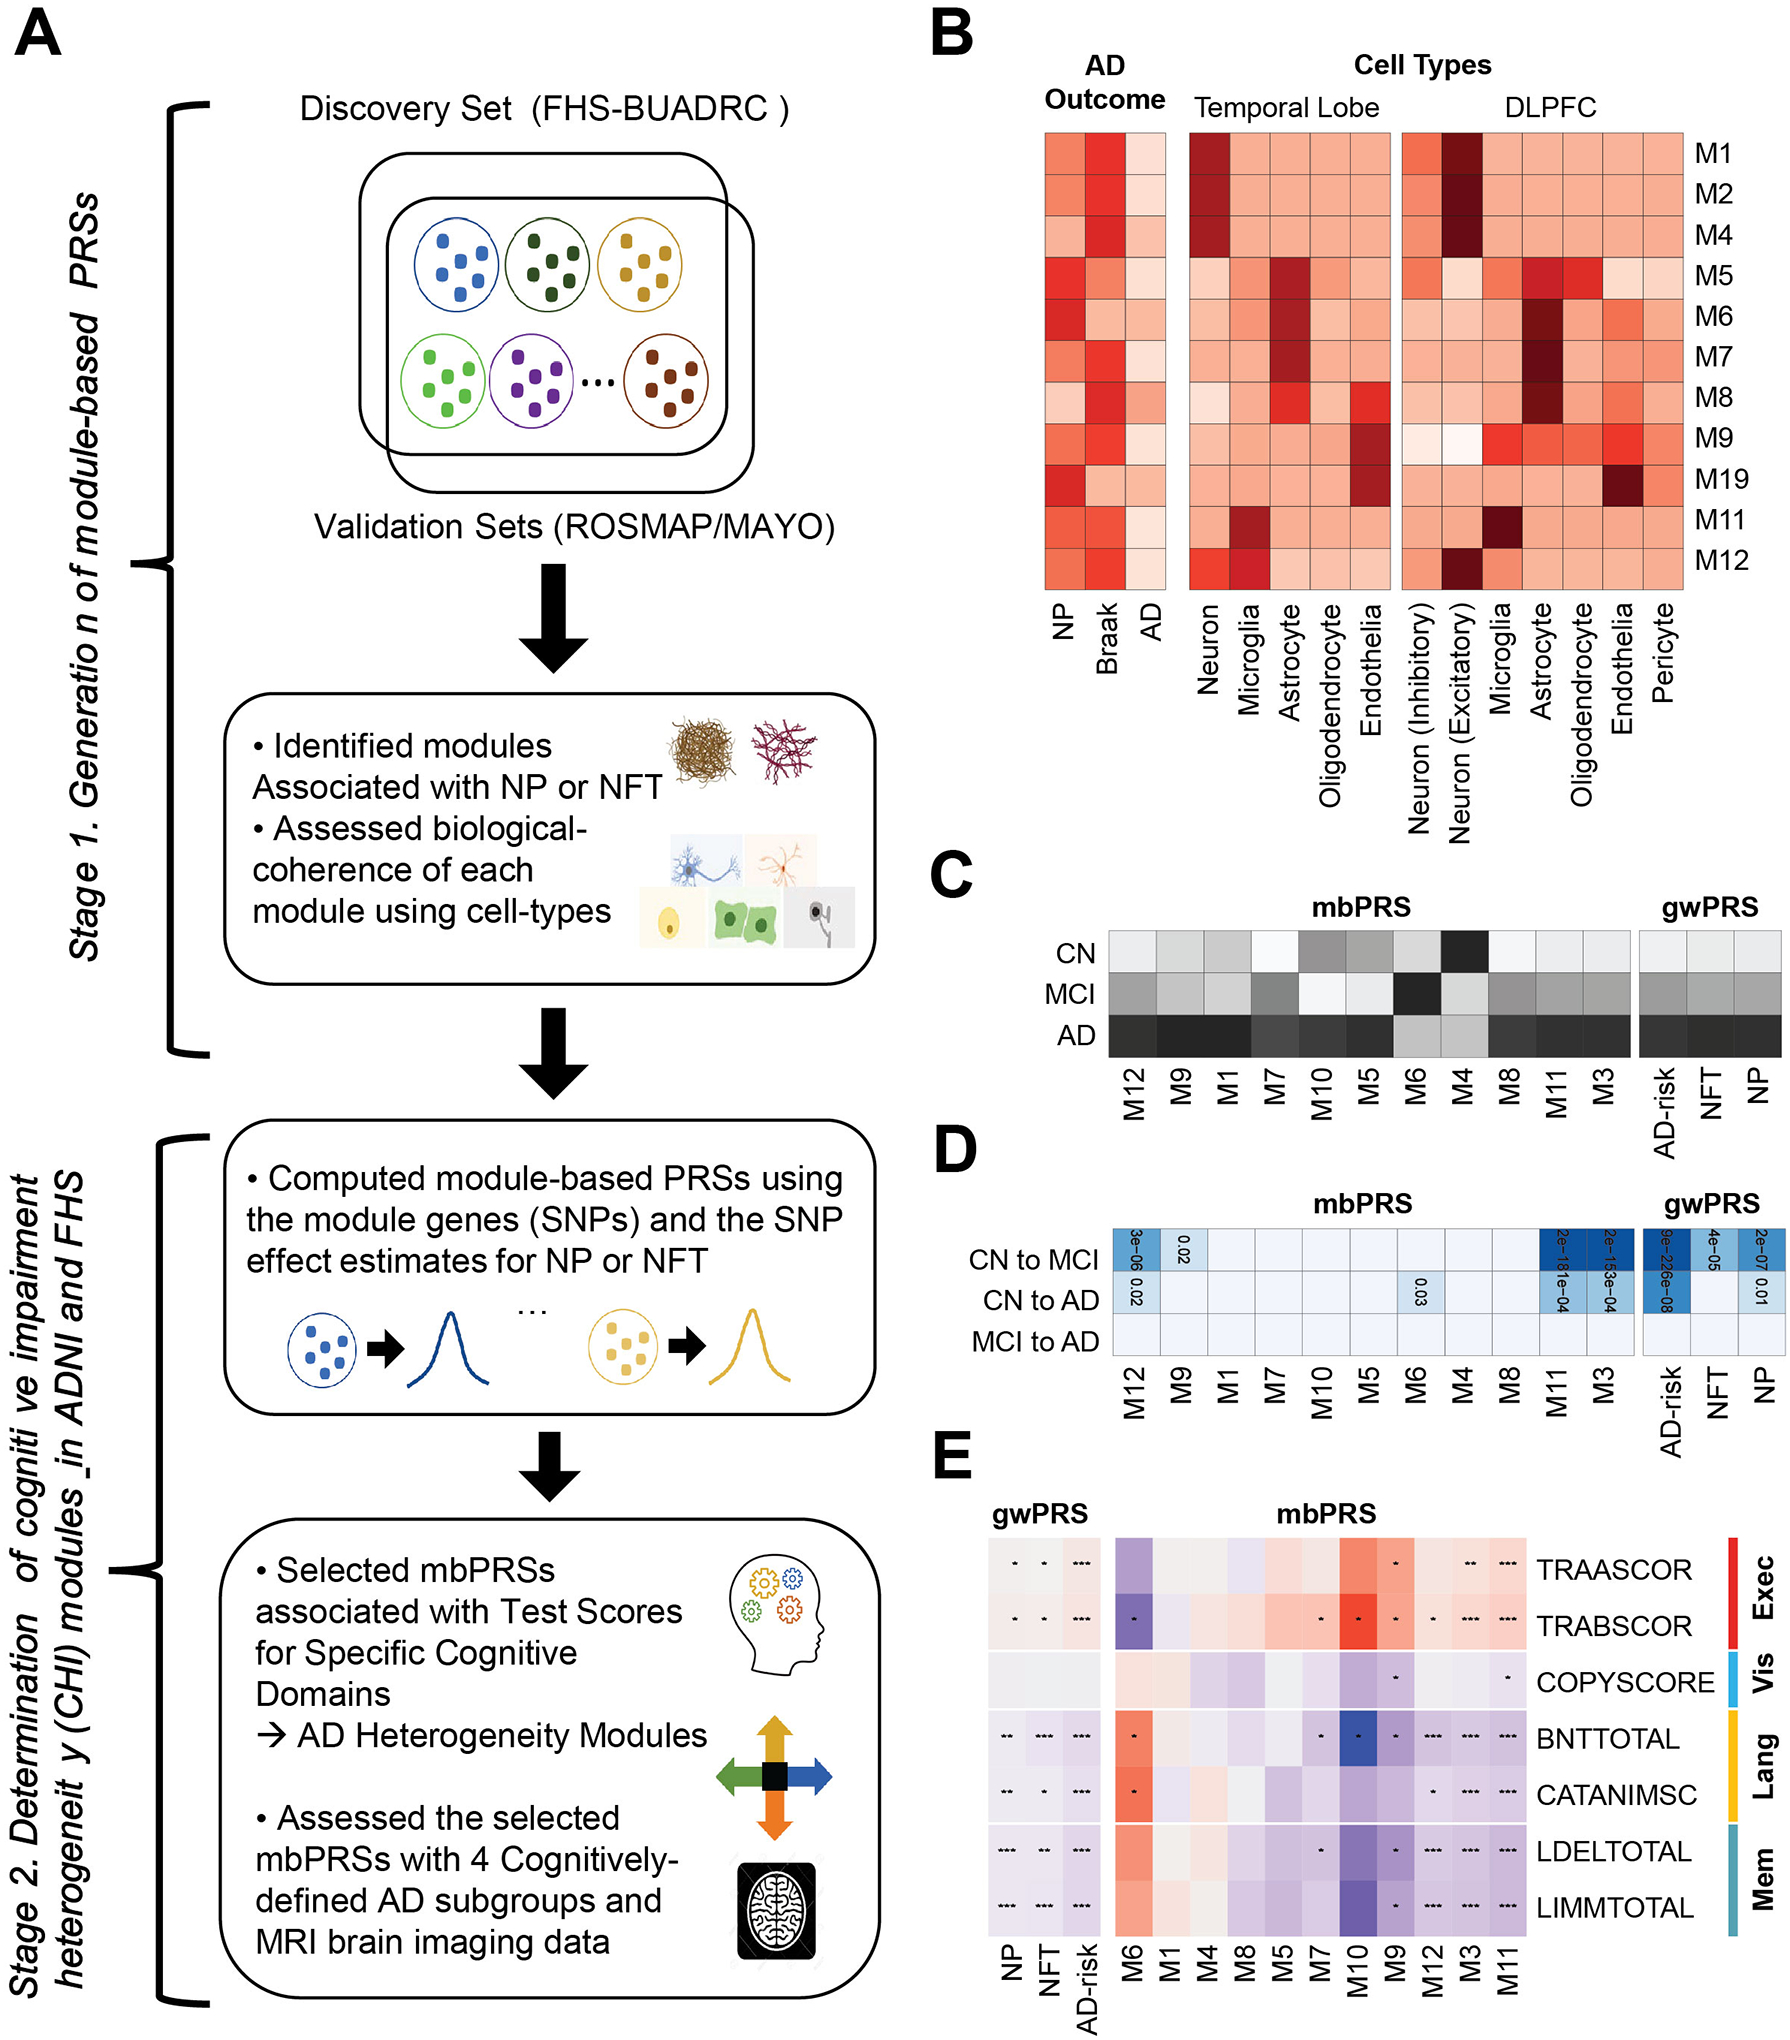
Figure 1.

A. Schematic of our study design. We constructed co-expression modules (sets of genes), selected AD-associated modules, and generated module-based polygenic risk scores for explaining the AD heterogeneity, which were tested and evaluated with gene-sets for AD-related neuropathological traits (NP and NFT human brain cell-types, cognitive test scores, cognitively-defined AD subgroups, and brain MRI imaging data. B. Enrichment analysis. The strength of enrichment results with the eleven AD-associated modules for AD phenotypes (NP, NFT, and AD-risk; left) and cell type specific gene-sets in temporal lobe (middle) and dorsal lateral prefrontal cortex (DLPFC; right). The darker color indicates the more significant enrichment P-value. C. Heatmap of mean values for module-based PRSs (mbPRSs) and genome-wide PRSs (gwPRSs) across the disease stages including clinical normal (CN), mild cognitive impairment (MCI), and AD (the darker color indicates the larger mean value of the PRS). D. Associations between PRSs (mbPRSs and gwPRSs) and disease progression (CN to MCI, CN to AD, MCI to AD) (the darker color indicates the more significant P-value). E. Associations between PRSs (mbPRSs and gwPRSs) and seven test scores for four cognitive domains (executive functioning, visuospatial functioning, language, memory). Red and blue mean positive and negative effect directions, respectively. Dots in the cells indicate the strength of associations).
