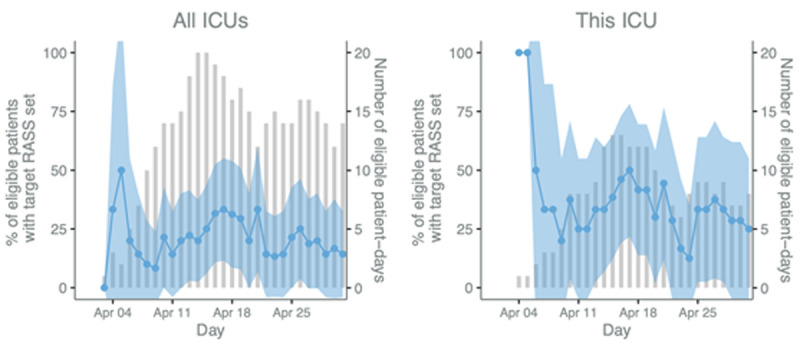
Figure 2. Process evaluation p-charts of Richmond Agitation-Sedation Scale (RASS) rates.

The blue line and shaded 95% CI area (left y-axis) display the daily percentage of eligible patients who had a target RASS set and the bars (right y-axis) represent the number of eligible patients. Patients are eligible if they are mechanically ventilated on that day.
