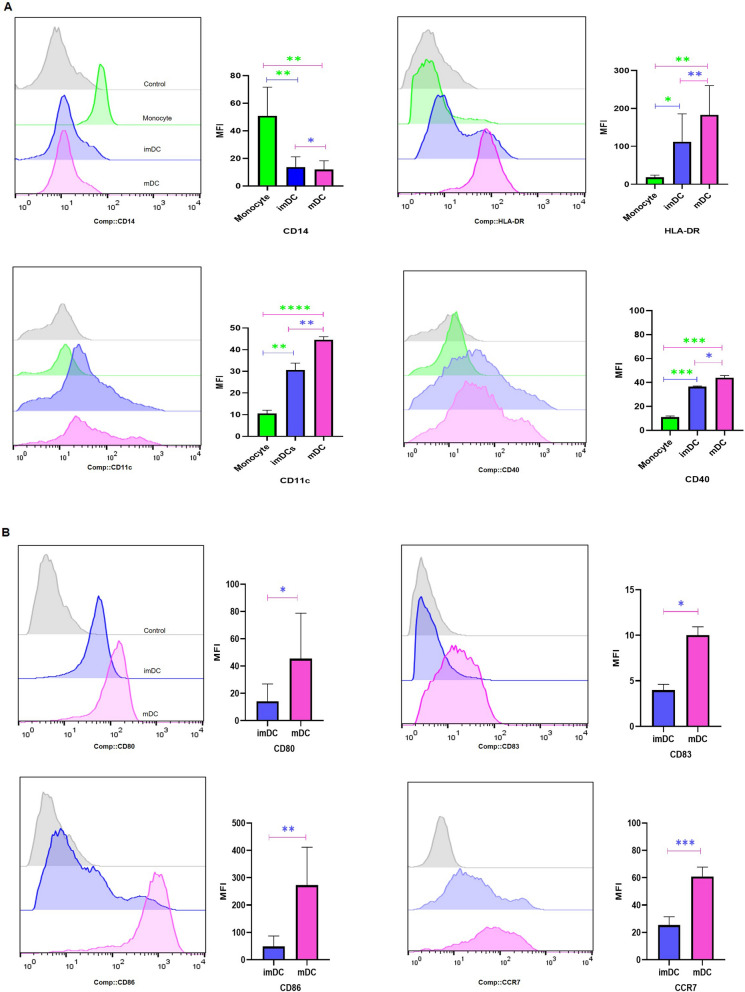
Fig. 1.
Flow cytometric and quantitative bar chart analyses of surface marker expression. A Expression of CD14, HLA-DR, CD11c, and CD40 are shown among monocytes, imDCs, and mDCs (n = 10). B Expression of CD80, CD83, CD86, and CCR7 are shown between imDCs and mDCs (n = 10). Histograms show the expression of each marker in a representative experiment, and the bar diagrams indicate the mean MFI ± SD for each marker. All groups showed significant differences in the expression of surface markers. A paired t test was used to compare the differences between two groups. *p ≤ 0.05, **p ≤ 0.01, ***p ≤ 0.001, ****p ≤ 0.0001. Control: isotype control, imDC: immature DCs, mDC: LP-loaded mature DCs

