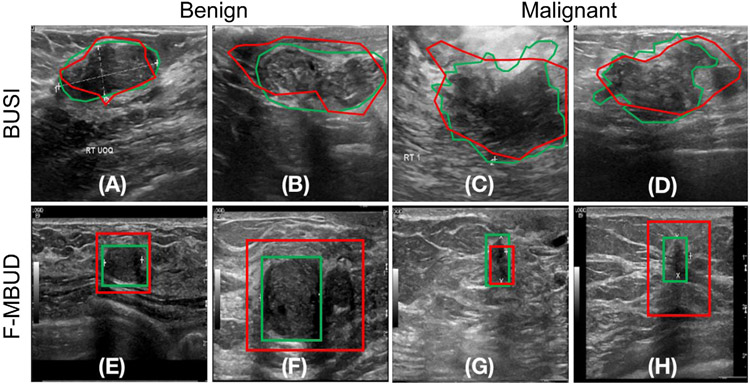
Fig. 5.
Examples of predicted lesion masks using our method in the BUSI dataset (top row) and F-MBUD dataset (bottom row). The green contours indicate the GT lesion locations, while the red contours show the predicted lesion locations. (A) and (B) are two benign examples from the BUSI dataset. (C) and (D) are two malignant examples from the BUSI dataset. (E) and (F) are two benign examples from the F-MBUD dataset. (G) and (H) are two malignant examples from the F-MBUD dataset.

