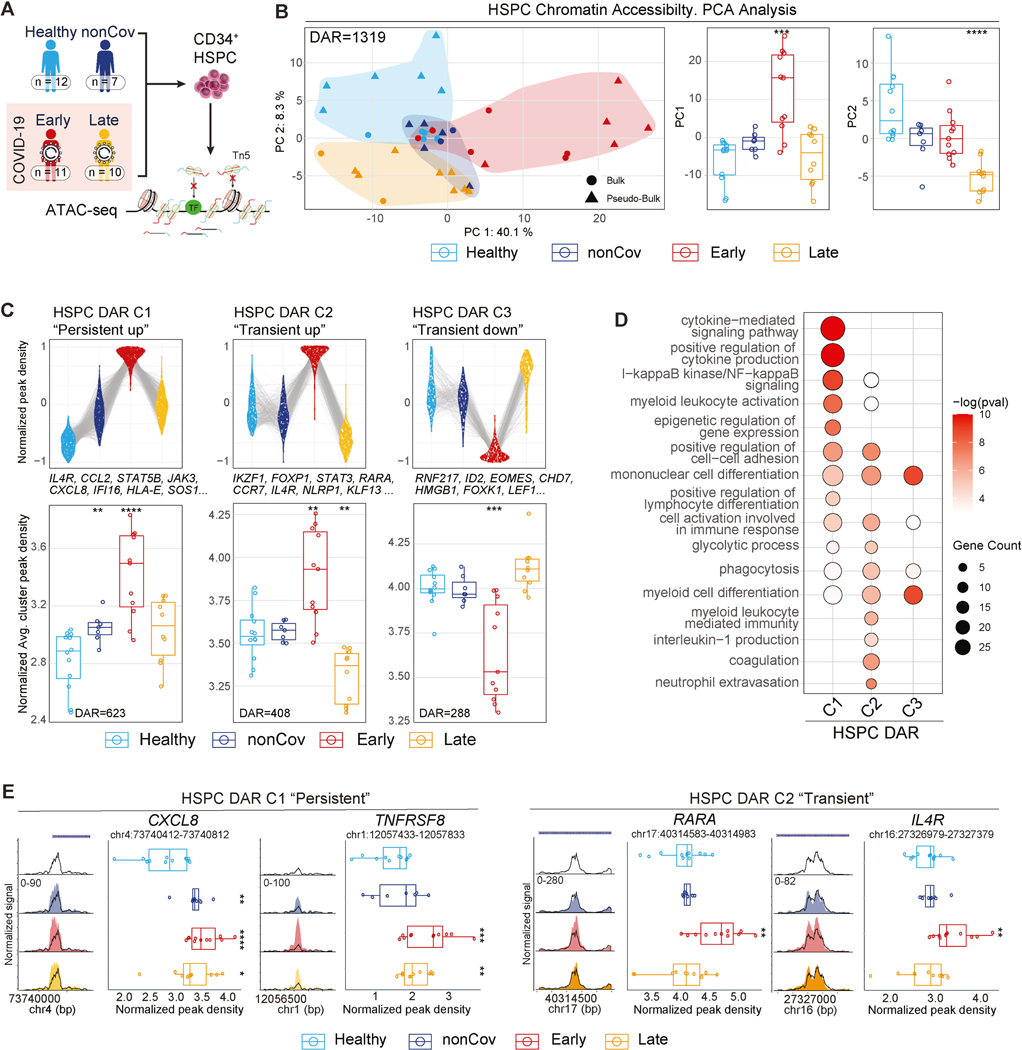
Figure 4. Sustained epigenetic alterations in CD34+ HSPC following severe COVID-19.
(A) Overview depicting clinical groups and ATAC-seq workflow used for epigenomic profiling of CD34+ HSPC.
(B) PCA plot of HSPC ATAC-seq samples using the combined set of DAR (left). Boxplots (right) show PC1 and PC2 values for each donor across groups.
(C) Top: Normalized read density of all DAR in each clusters by groups. Each DAR (group average) is represented by a linked line across groups (top). Bottom: Cluster average of normalized DAR density score for individuals within groups.
(D) GO analysis of genes associated to cluster-specific DAR in HSPC. (p<0.05)
(E) ATAC-seq genome tracks for representative cluster-specific DAR in HSPC. Boxplots display normalized DAR densities for each donor across groups.

