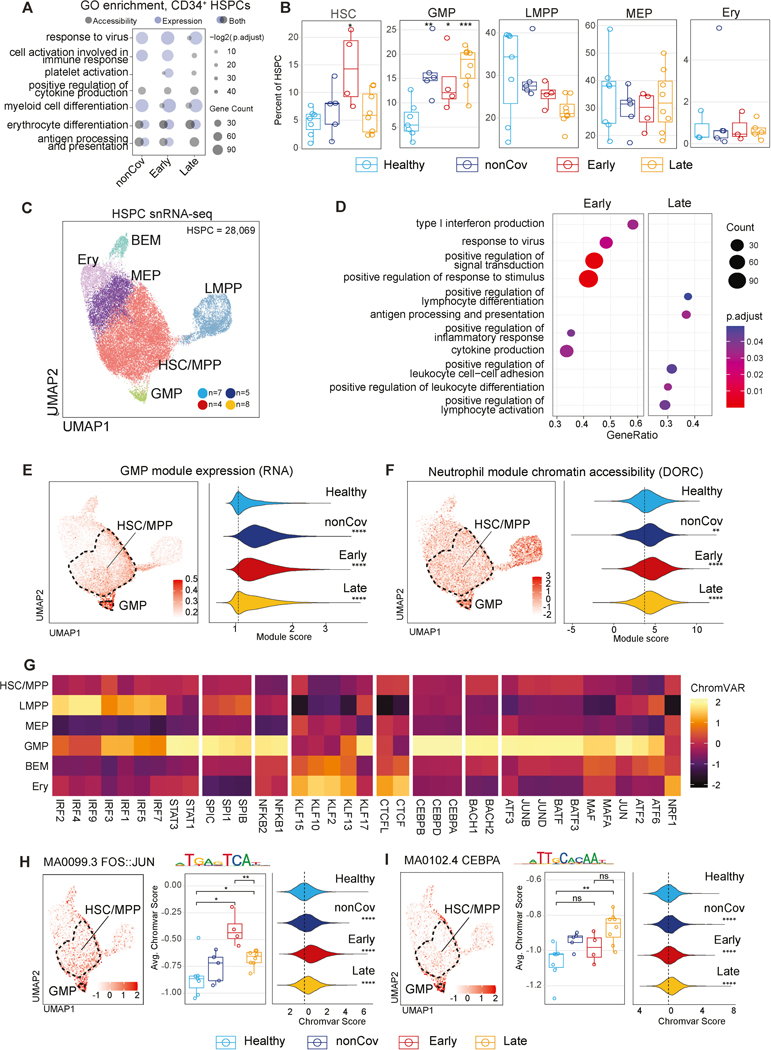
Figure 5. Durably altered phenotypes and programs in HSPC following severe COVID-19.
(A) GO analysis of genes with upregulated expression, and chromatin accessibility (DORC) in HSPC of each clinical group compared to Healthy.
(B) Frequency of HSPC subcluster among total HSPC for individual across groups.
(C) UMAP of HSPC with subtype annotations.
(D) Gene set enrichment analysis (GSEA) between Early and Late HSPC.
(E-F) UMAP displaying GMP module score (E) and DORC scores for the neutrophil module (F) per cell (left). Distribution of the module scores per cell in each clinical group (right).
(G) Heatmap of chromVAR score (Z-score-normalized median) for subtype-defining TFs.
(H-I) chromVAR scores for FOS::JUN and CEBPA in HSPC. TF scores projected on HSPC UMAP (left). Average TF score per individual (middle) and per-cell score (right) across groups.

