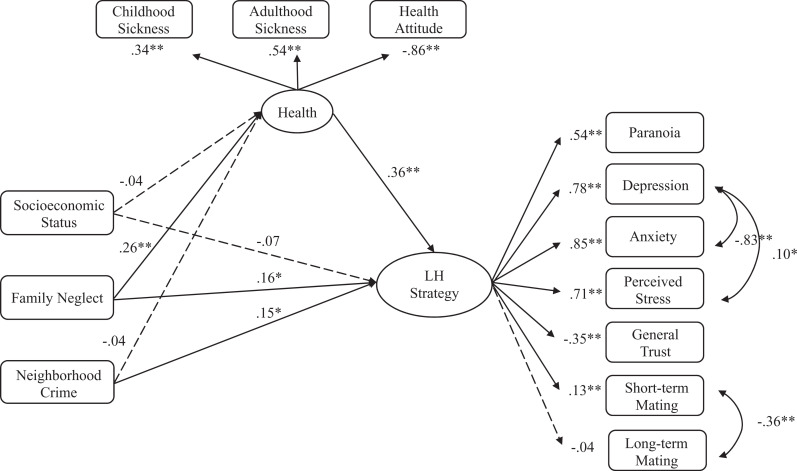
Figure 2.
Path model illustrating direct effects of environmental harshness on life history strategy and indirect effects through health for Study 2 (undergraduates). Dashed lines represents no significance. Standardized path coefficients for direct paths are shown. Latent variables are represented in ovals, and the observed variables are represented in rectangles. *p < .05. **p < .01.

