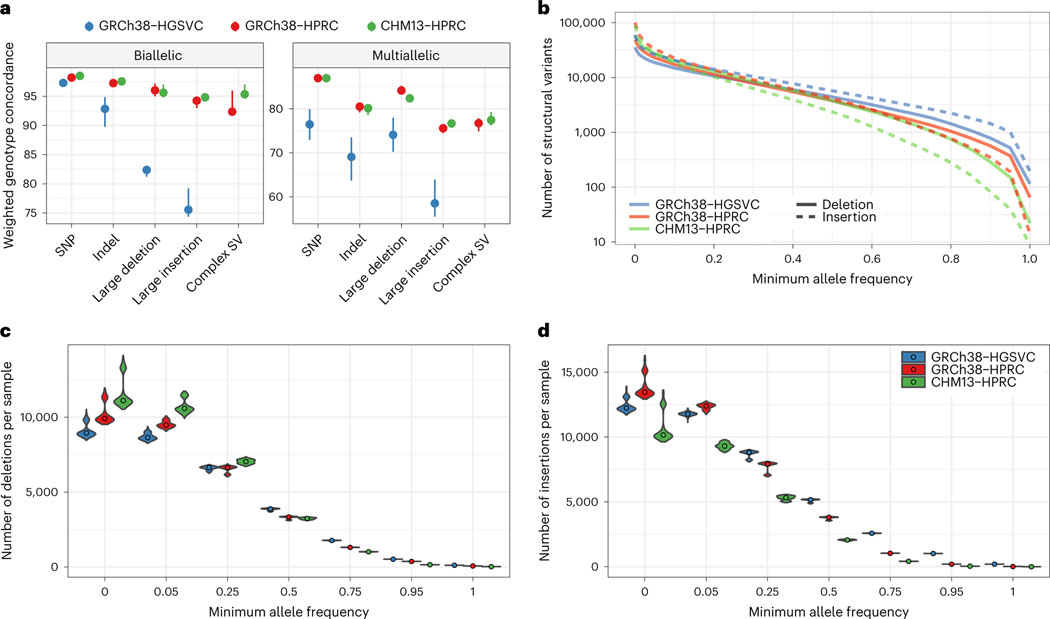
Fig. 3 |. Comparing pangenome SV genotyping.
a, Leave-one-out PanGenie validation measures the concordance of haplotypes as genotyped by short reads with the haplotypes created using genome assembly. The dots show the medians of five samples independently validated in this way. The error bars extend to the minimum and maxiumum values. Note that different samples were used for the HGSVC graph than for the HPRC graphs. b, log-scaled number of SVs given a minimum allele frequency in the PanGenie genotypes. c, The number of SV deletions genotyped per sample, stratified across six minimum allele frequency thresholds. The violin plots show the distribution across 368 samples, whereas the dots represent the median. d, The number of SV insertions genotyped per sample, stratified across six minimum allele frequency thresholds.

