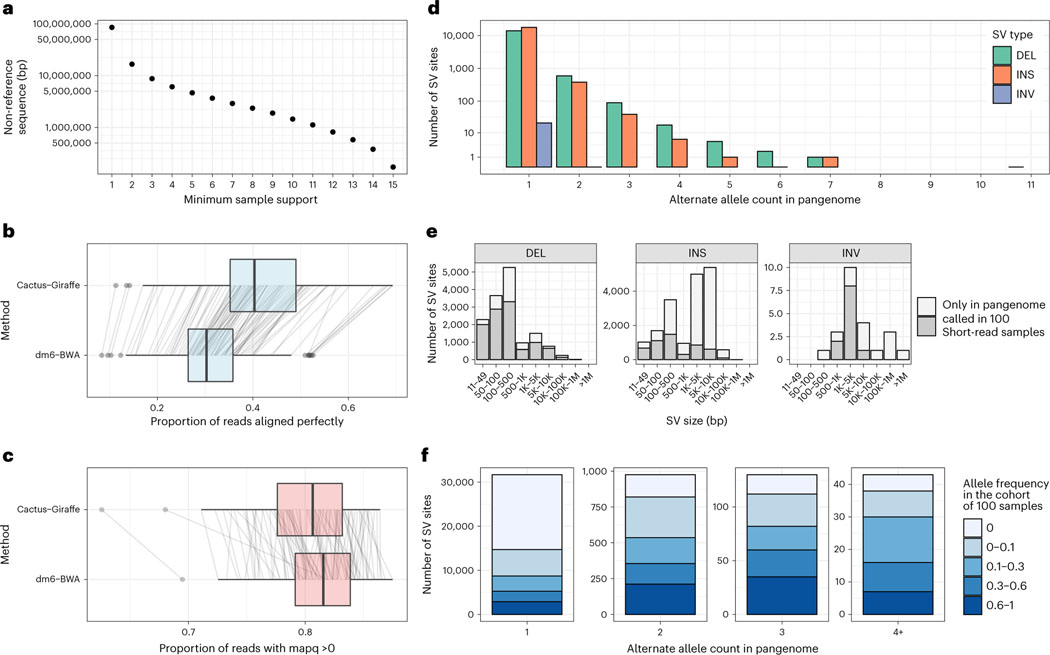
Fig. 4 |. A D. melanogaster pangenome.
a, Amount of non-reference sequence by minimum number of haplotypes it occurs in for the D. melanogaster pangenome. b,c, Reads mapped by two approaches (y axis): ‘Cactus-Giraffe’, where short reads are aligned to the pangenome using vg Giraffe, and ‘dm6-BWA’, where reads were mapped to dm6 using BWA-MEM. The box plots show the median (center line), upper and lower quartiles (box limits) up to 1.5× interquartile range (whiskers) and outliers (points). The lines connect the same sample between the two approaches. The x axis shows the proportion of reads that align perfectly (b) or the proportion of reads with a mapping quality (mapq) above 0 (c). d, Distribution of the alternate allele count across each SV site. The x axis represents the number of assemblies in the pangenome that support an SV. The y axis is log-scaled. e, The size distribution (x axis) of different SV types (panels). The SV sites are separated in two groups: SV sites that were called in at least one sample from the cohort of 100 samples with short reads (dark gray) and SV sites present only in the pangenome (light gray). f, Fraction of SVs of different frequency in the cohort of 100 samples (color) compared to their frequency in the pangenome (x axis). DEL, deletions; INS, insertions; INV, inversions.

