Figure 5.
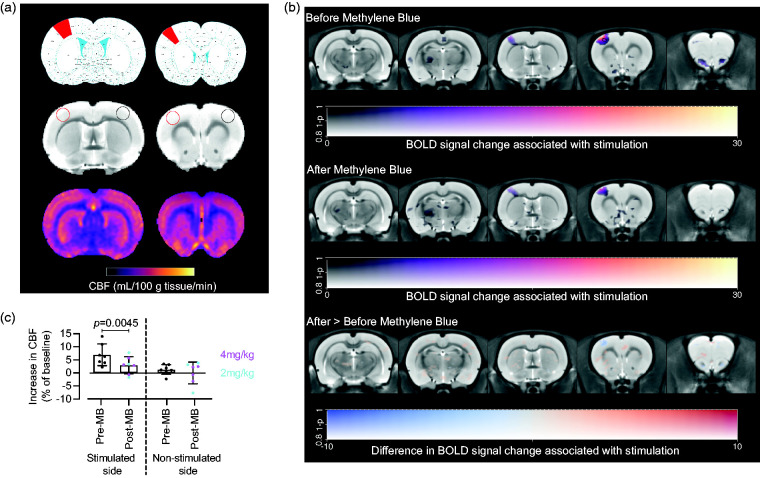
Rat CBF and BOLD responses to forepaw stimulation (n = 7). (a) ROIs (top – rat brain atlas showing location of forelimb S1 cortex (red); middle – structural images showing location of ROIs – red stimulated side, black non-stimulated side; bottom, representative CBF maps; (b) BOLD responses voxelwise for before (top) and after (middle) MB. The difference between the two conditions was tested (bottom) with a two-way ANOVA with MB dose and condition as factors. The response to stimulation is significant before MB (black contour denotes p < 0.001 uncorrected), but not after, although the difference between the two conditions is not significant and (c) CBF % change from baseline, which was only significantly increased before, but not after MB, in the contralateral forelimb cortex (p = 0.0045, one sample t test, compared to 0).

