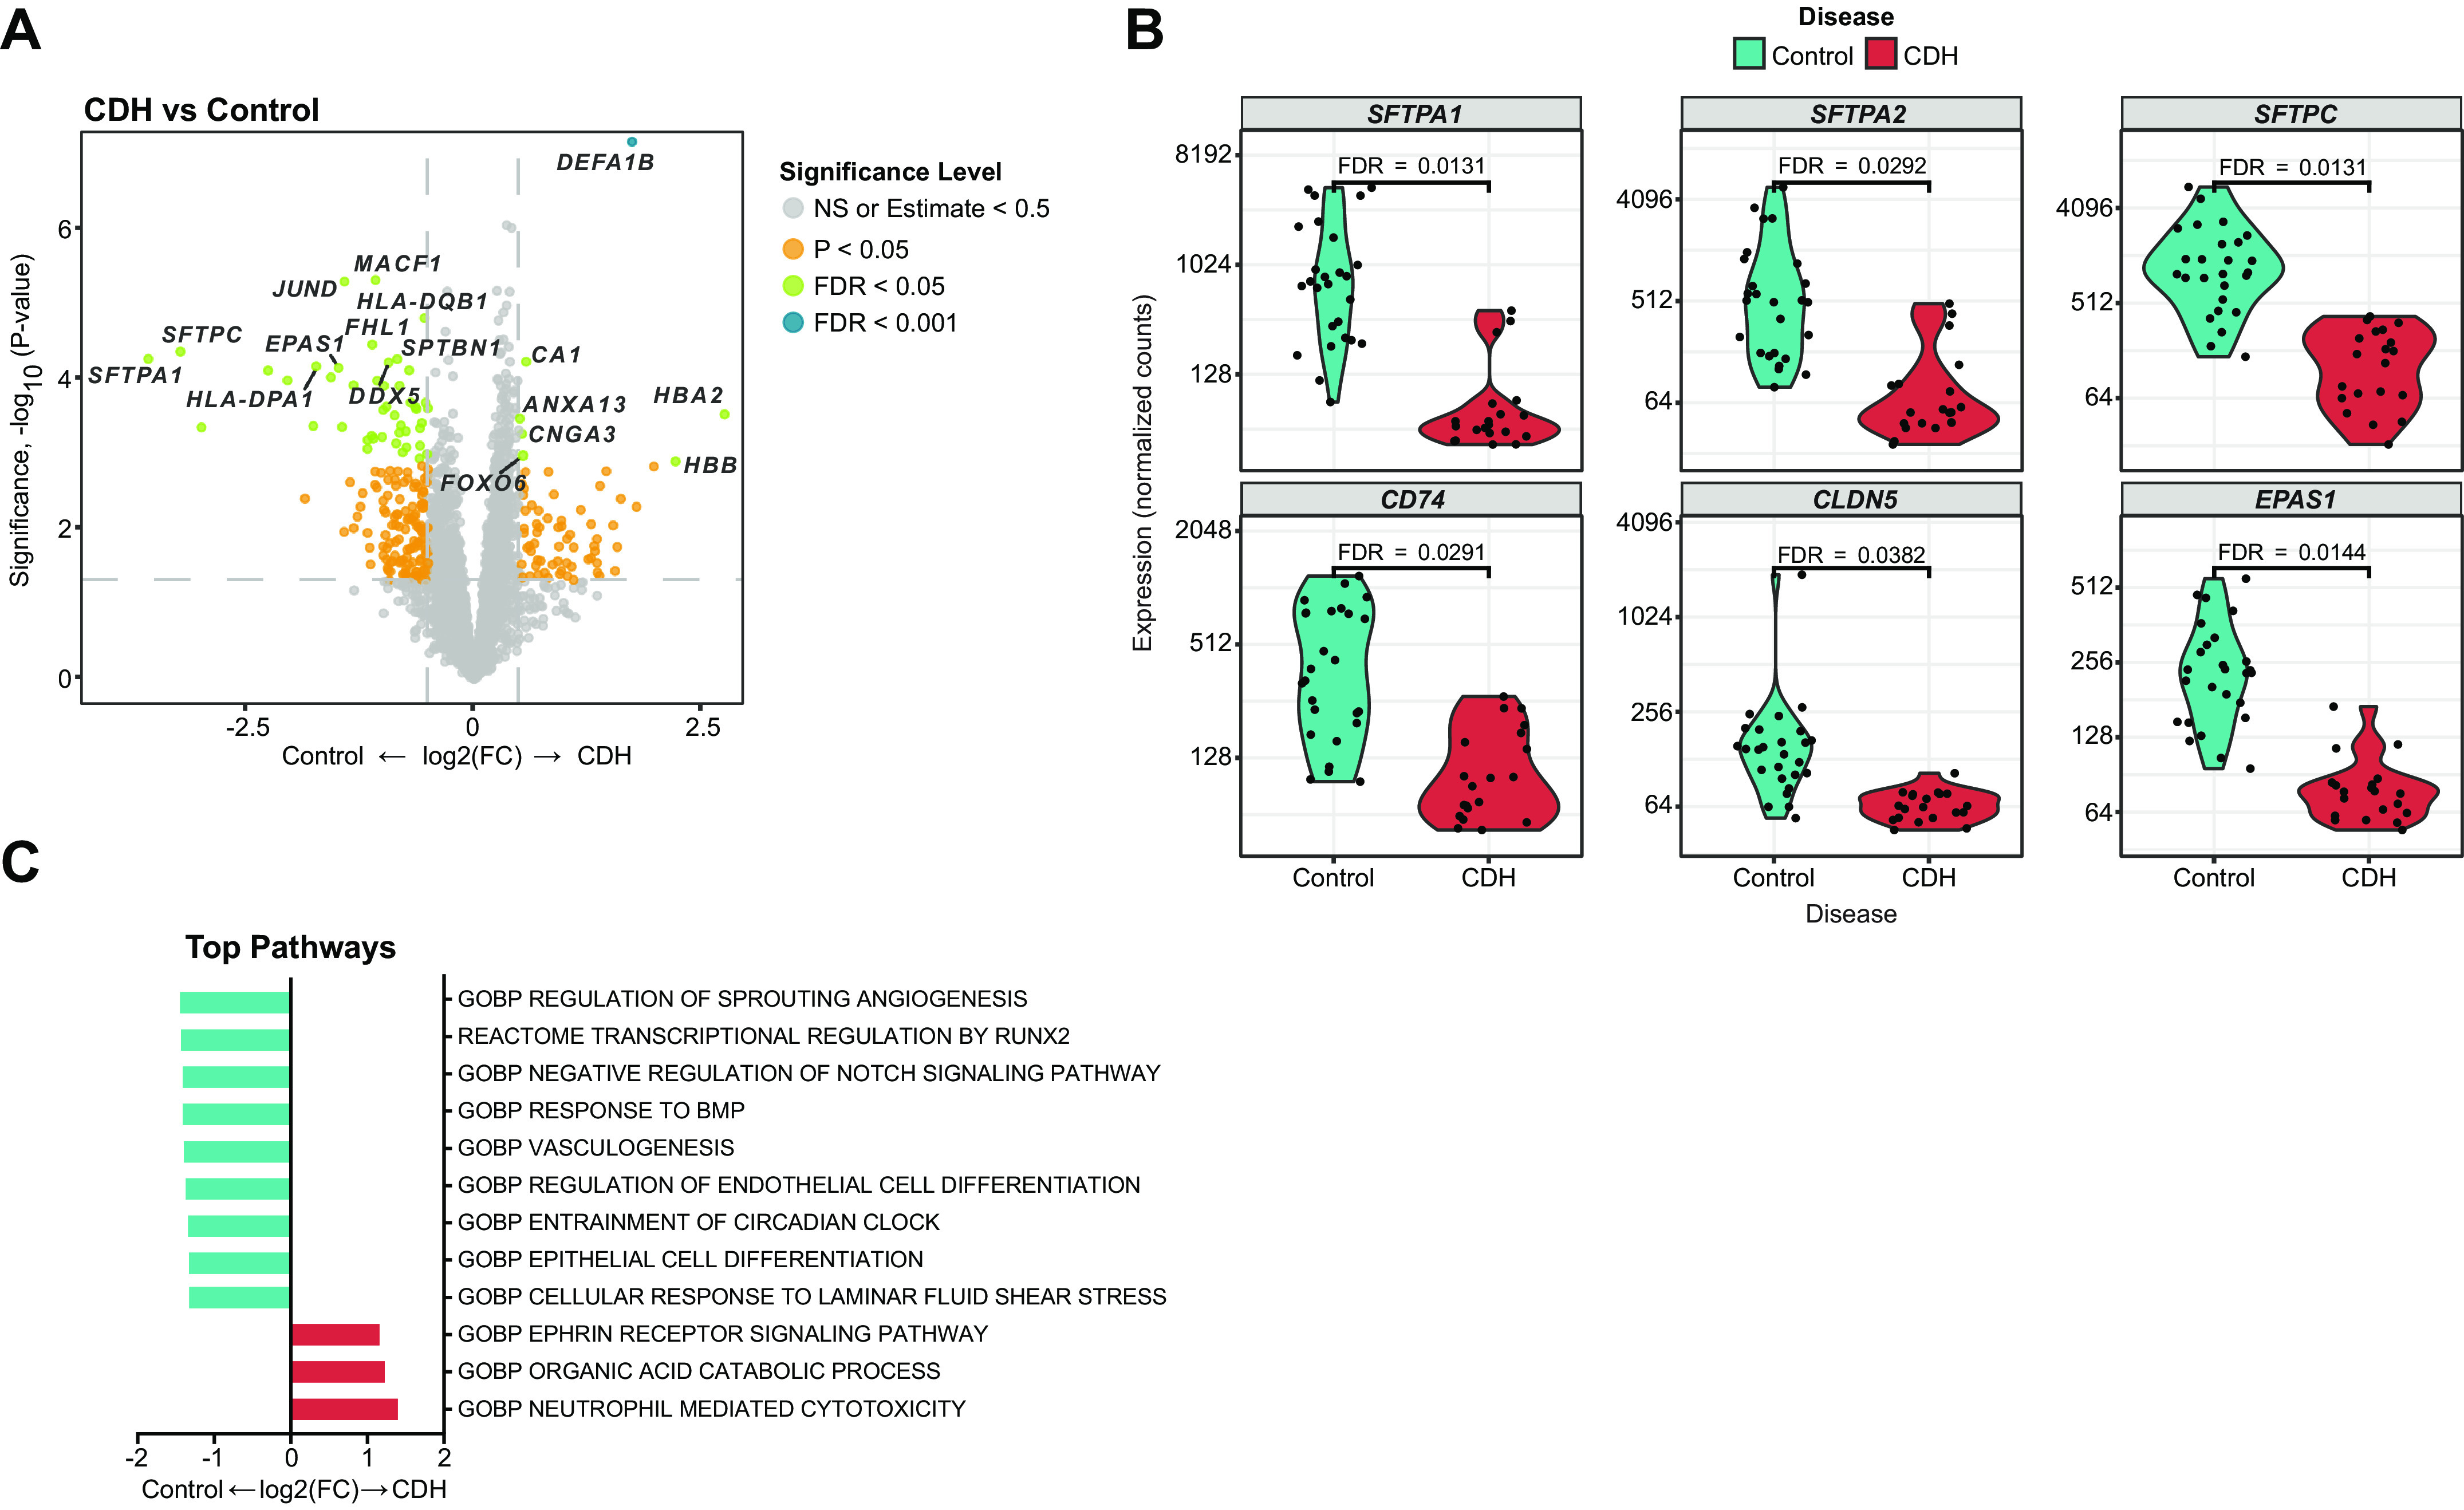
Figure 2.

Spatial transcriptomic analysis of the human CDH and control lung reveals key differences in the gene expression signature. Spatial transcriptomic analysis of lung sections obtained from patients with CDH (n = 4/sex/group) were compared with age- and sex-matched controls. A: volcano plots showing differentially expressed genes (DEGs) in control vs. patients with CDH. DEGs upregulated in controls are shown on the left (negative) and genes upregulated in CDH are on the right (positive). Gray dot: NS, orange: P < 0.05, green: FDR < 0.05. B: violin plots showing normalized expression values (counts) of selected genes; epithelial (SFTPA1, SFTPA2, SFTPC, and CD74) and endothelial (EPAS1 and CLDN5) in CDH and control lungs. C: enriched biological pathways in the CDH vs. control lung. CDH, congenital diaphragmatic hernia; FDR, false discovery rate; NS, not significant.
