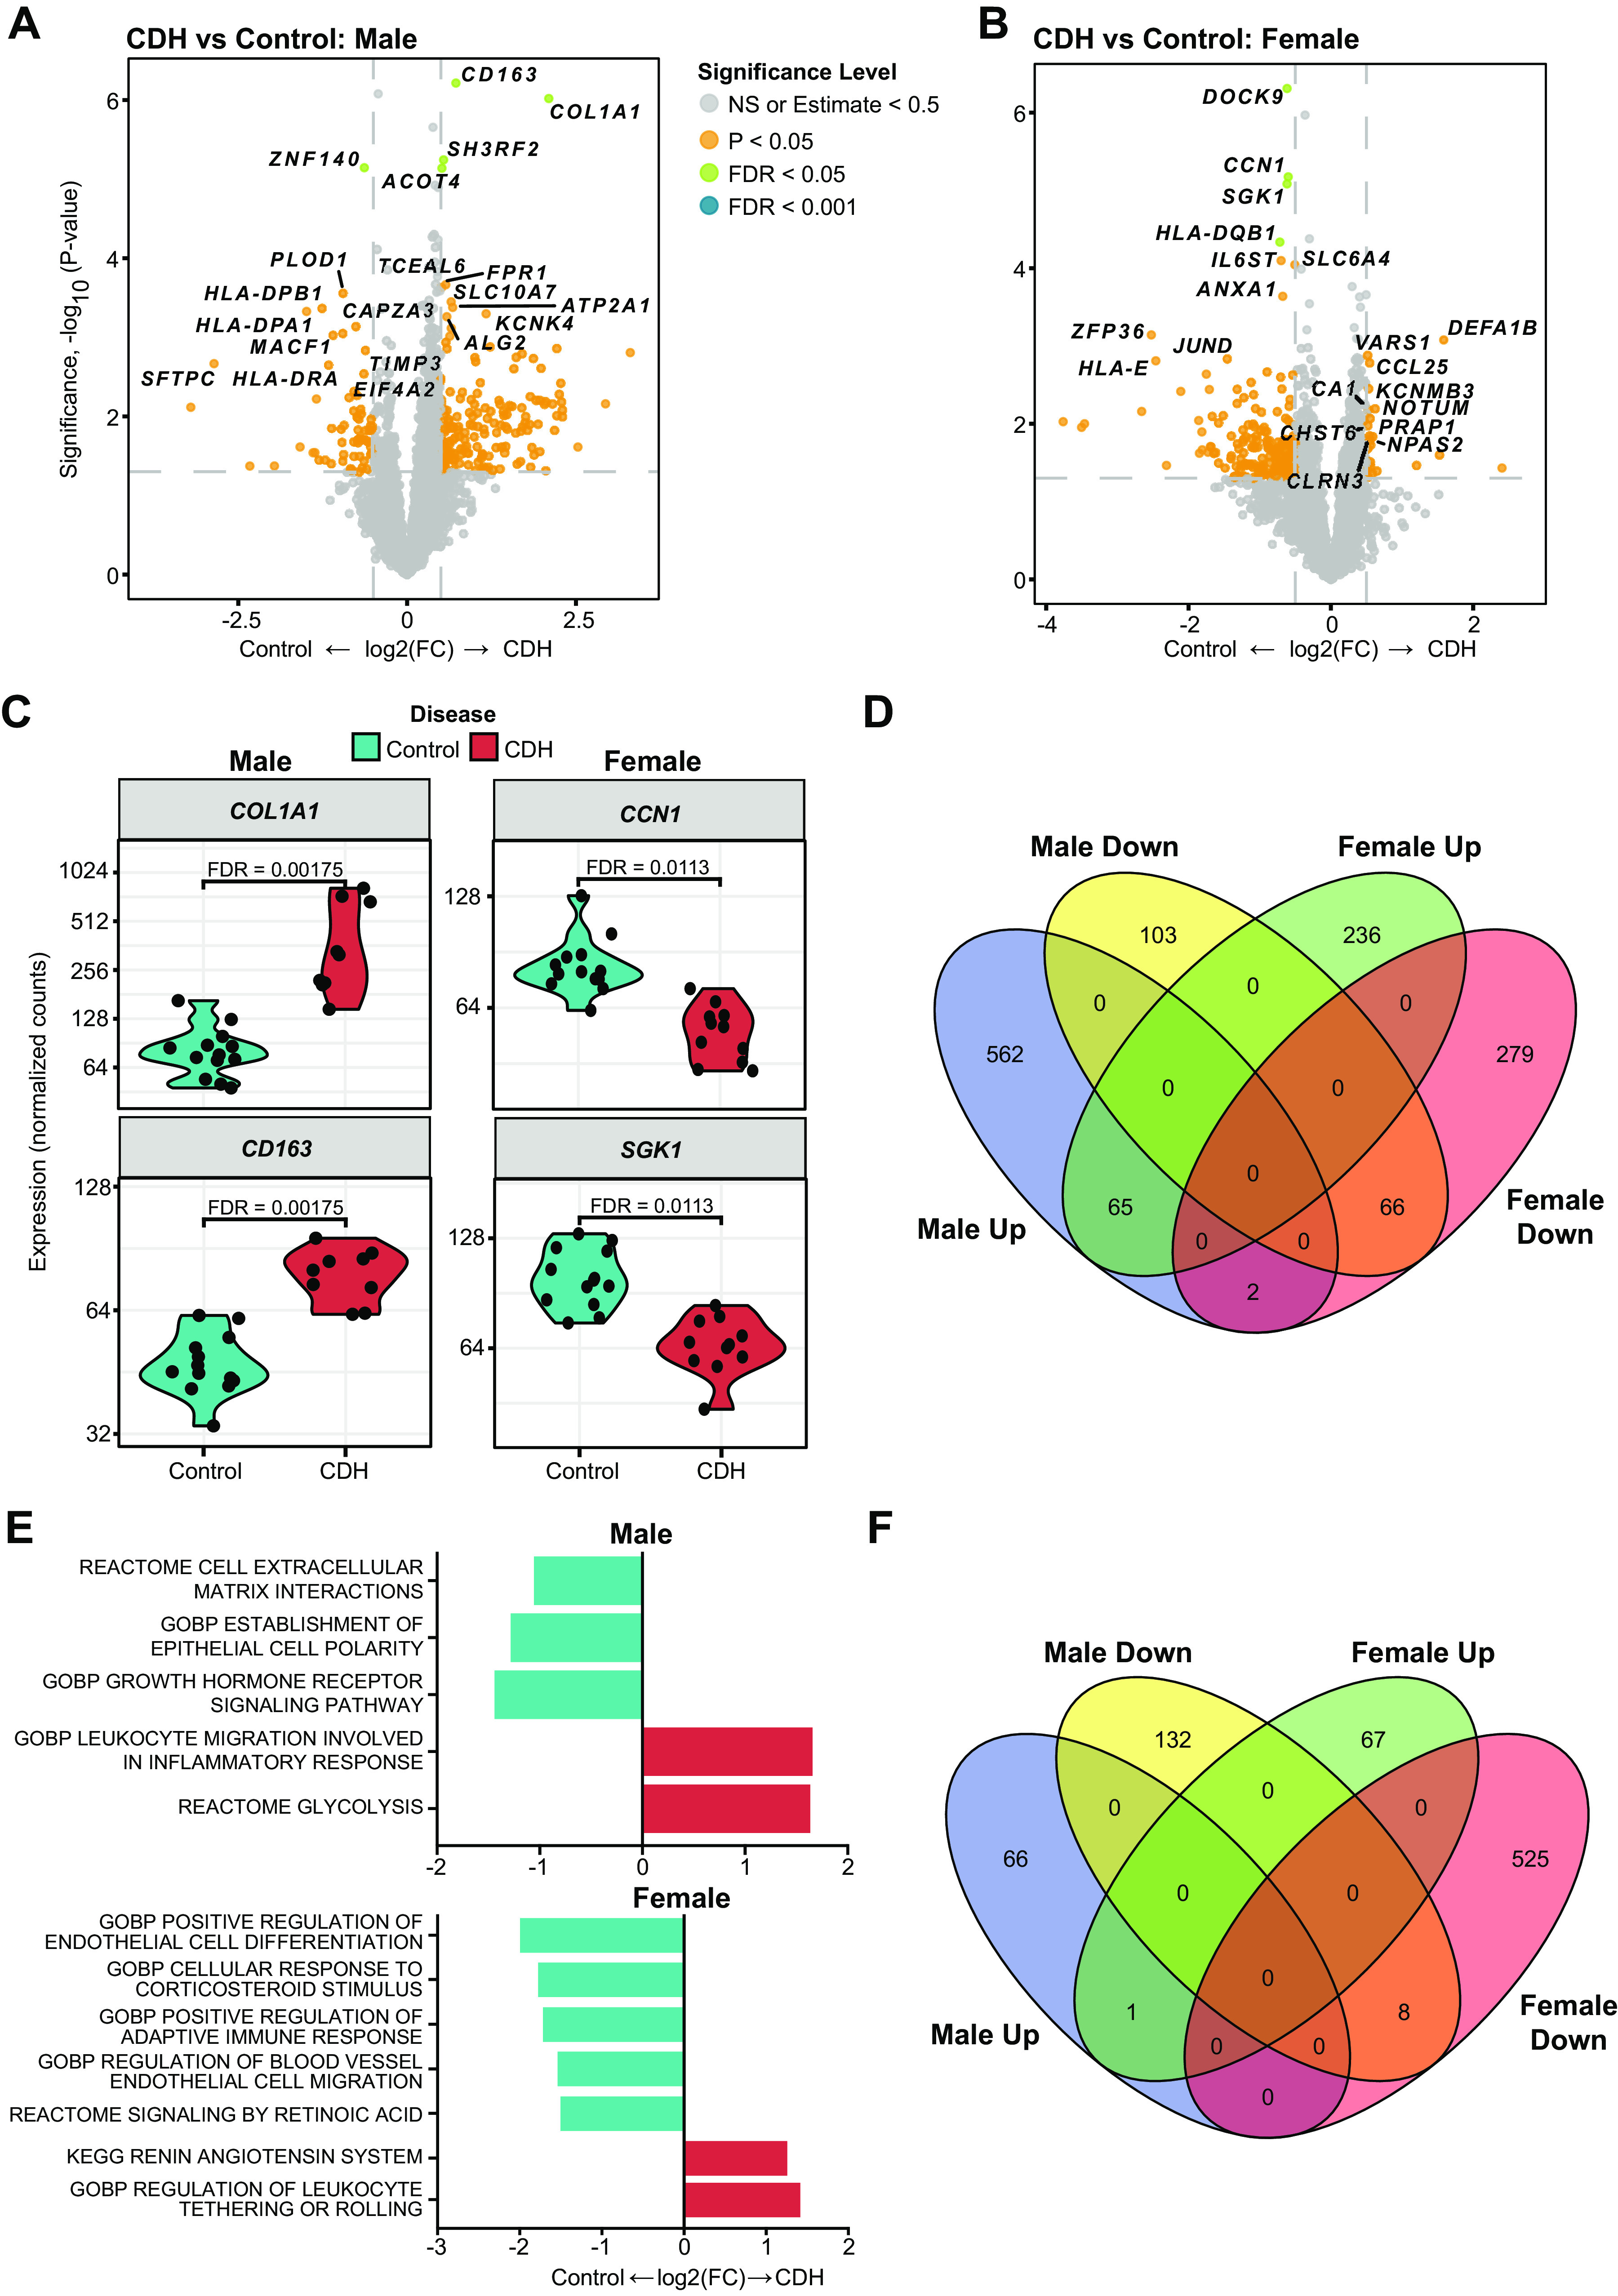
Figure 3.

Marked sex-specific differences in differentially expressed genes and enriched biological pathways in male and female CDH in lung parenchymal regions analyzed by spatial transcriptomics. Spatial transcriptomic analysis of lung sections obtained from male and female patients with CDH (n = 4/sex/group) were compared with age- and sex-matched controls. Volcano plots showing differentially expressed genes (DEGs) in male control vs. patients with CDH (A) and female control vs. patients with CDH (B). DEGs upregulated in controls are shown on the left (negative) and genes upregulated in CDH are on the right (positive). Gray dot: NS, orange: P < 0.05, green: FDR < 0.05. C: violin plots showing normalized expression values (counts) of selected genes; in male and female CDH and control lungs. D: four-way Venn diagram showing minimal overlap between males and females in differentially expressed genes. E: enriched biological pathways in the male and female CDH lung compared with sex-matched control lungs. F: four-way Venn diagram showing very little overlap between males and females in enriched biological pathways. CDH, congenital diaphragmatic hernia; FDR, false discovery rate.
