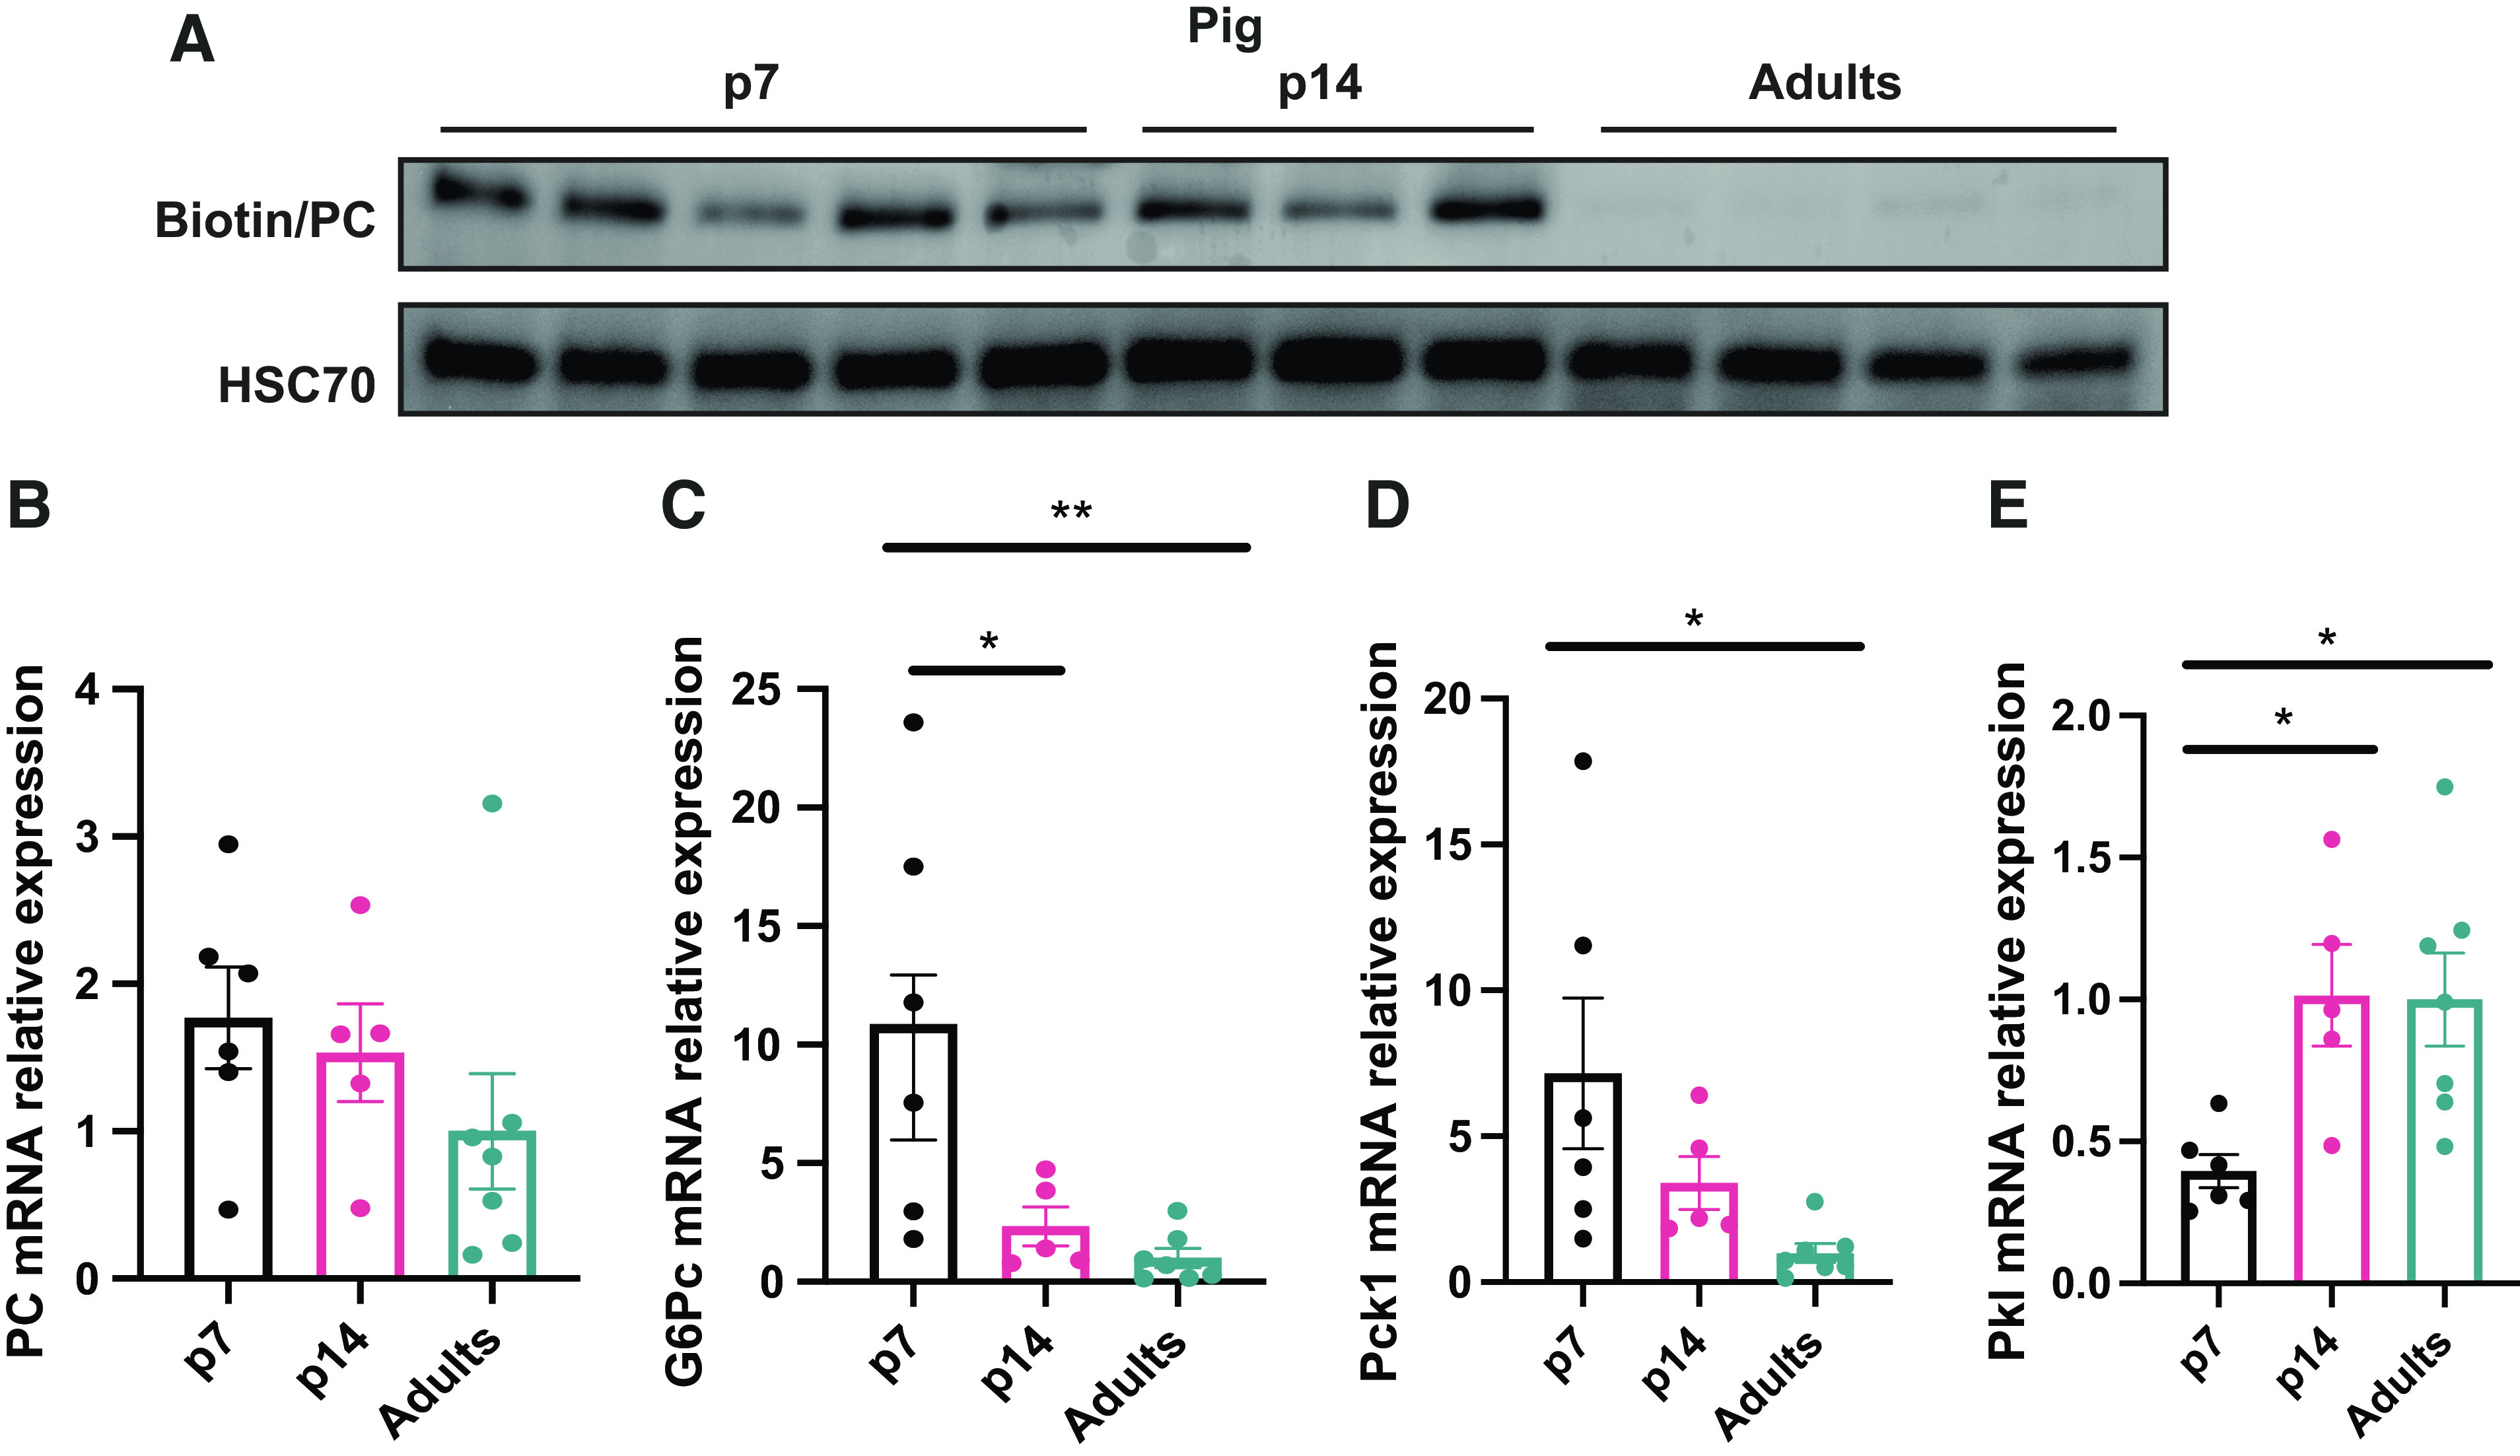
Figure 3.

Piglets exhibit an enhanced gluconeogenesis program. A: antibiotin/HSC70 Western blot. B: relative mRNA levels in the liver of Pcx. G6Pc (C), Pck1 (D), Pkl (E) by quantitative RT-qPCR. (n = 6) All bars represent means ± SE. *P < 0.05, **P < 0.01 vs. p7.
