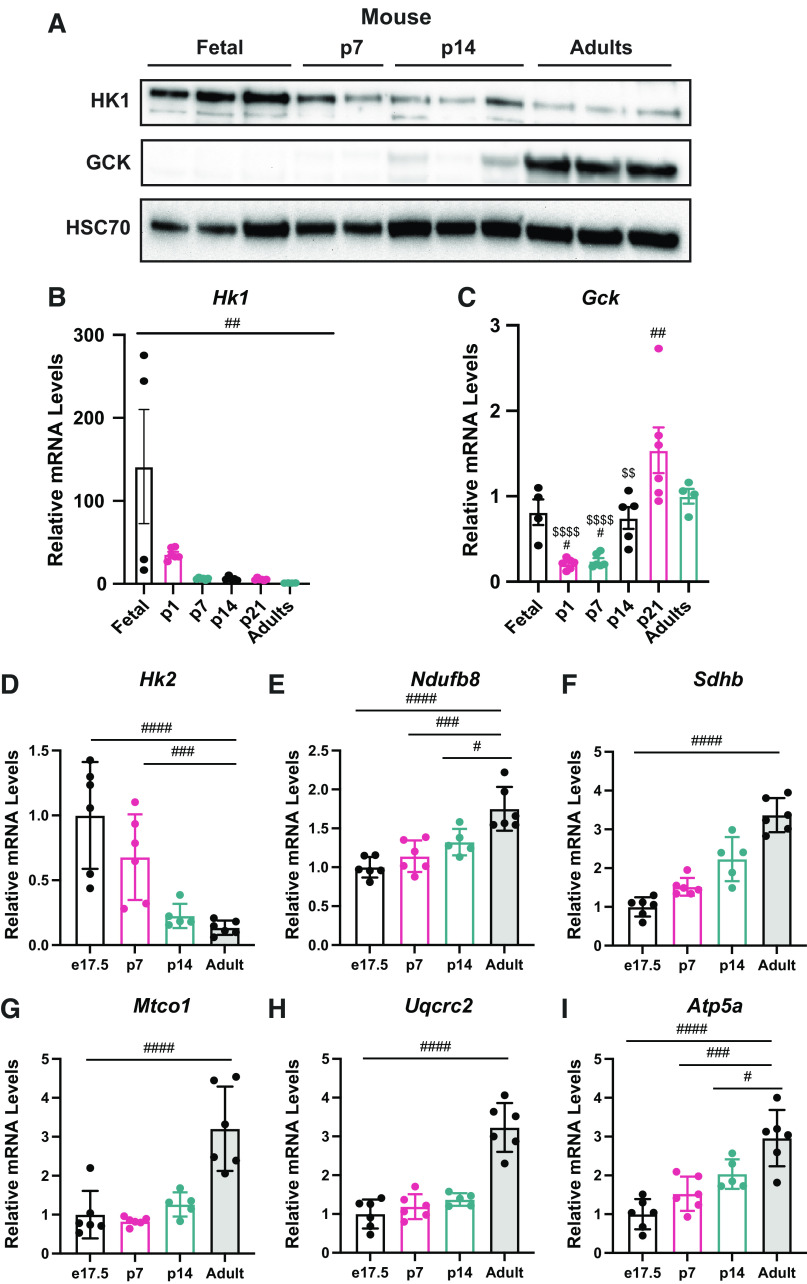
Figure 5.
Glucose kinases showed differential levels through development in mice. A: Western blots for HK1, GCK, and HSC70 in the liver of mice. B: Hk1 mRNA relative levels in the liver by quantitative RT-qPCR in mice. C: Gck mRNA relative levels in the liver by quantitative RT-qPCR in mice. Expression of Hk2 (D), Ndufb8 (E), Sdhb (F), Mtco1 (G), Uqcrc2 (H), and Atp5a (I) in mouse liver (n = 4–6). All bars represent means ± SE. #P < 0.05, ##P < 0.01, ### P < 0.001, ####P < 0.0001. GCK, glucokinase; HK1, hexokinase 1.

