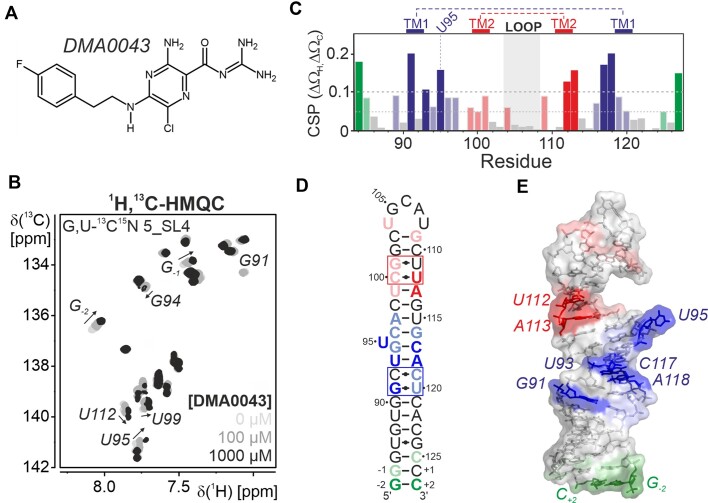
Figure 6.
(A) Chemical structure of the screening hit DMA0043. (B) Titration of DMA0043 to 5_SL4 followed by 1H,13C-HMQC spectra of the aromatic pyrimidine H6C6 and purine H8C8 moieties using a selectively G,U-13C,15N labeled sample. The spectra of the different titrations steps are shown in different shades of gray as indicated. For residues displaying significant shifts in the course of the titration, assignments are given and the peak shifts with increasing ligand concentration are indicated by arrows. (C) Combined 1H and 13C chemical shift perturbations of all aromatic H6/8C6/8 moieties of 5_SL4 with resolved resonances derived from the comparison of 1H,13C-HMQC spectra obtained in the absence or in the presence of 1 mM DMA0043. Cut-offs for small (0.05) and large shifts (0.1) are indicated by dashed lines. Non-canonical regions are highlighted. Different binding regions are colored blue (around TM1), red (around TM2) or green (terminal region) with large shifts in dark and small shifts in light colors. (D) CSPs induced by DMA0043 displayed on the secondary structure of 5_SL4. The region comprising TM1 and TM2 are shown in blue and red, respectively. The third binding region at the terminus of 5_SL4 is shown in green. Small CSPs (0.05–0.1) are shown in light red, light blue and light green, large shifts (>0.1) are shown in red, blue and green. (E) CSPs induced by DMA0043 displayed on the NMR structure of 5_SL4. The RNA is shown as a sphere and stick representation. Residues are highlighted according to the color scheme in (D).

