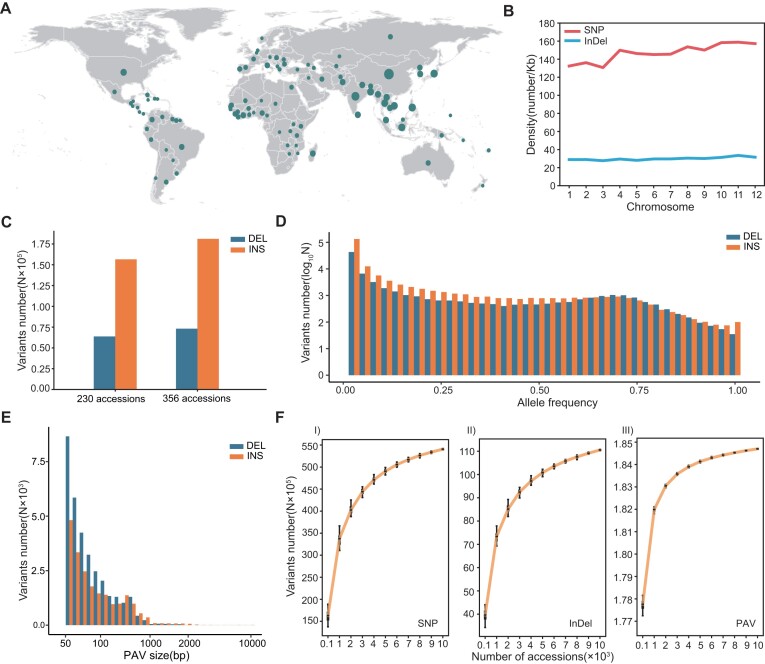
Figure 1.
Identification and evaluation of the genomic variants. (A) Geographical distribution characteristics of the 10 548 accessions in this study (nmin = 1, nmax = 4620). (B) Distribution of SNP and InDel on different chromosomes. (C) Comparison of deletion (DEL) and insertion (INS) detected in 356 rice accessions in this study and a previously reported population with 230 rice accessions. This comparison presented the additional detected variations caused by a larger population. (D) Allele frequency distribution for PAV sites in 356 rice accessions. (E) Size distribution characteristics of PAV in 10 548 accessions. (F) Saturation curves of different variations in 10 548 accessions.

