Figure 6.
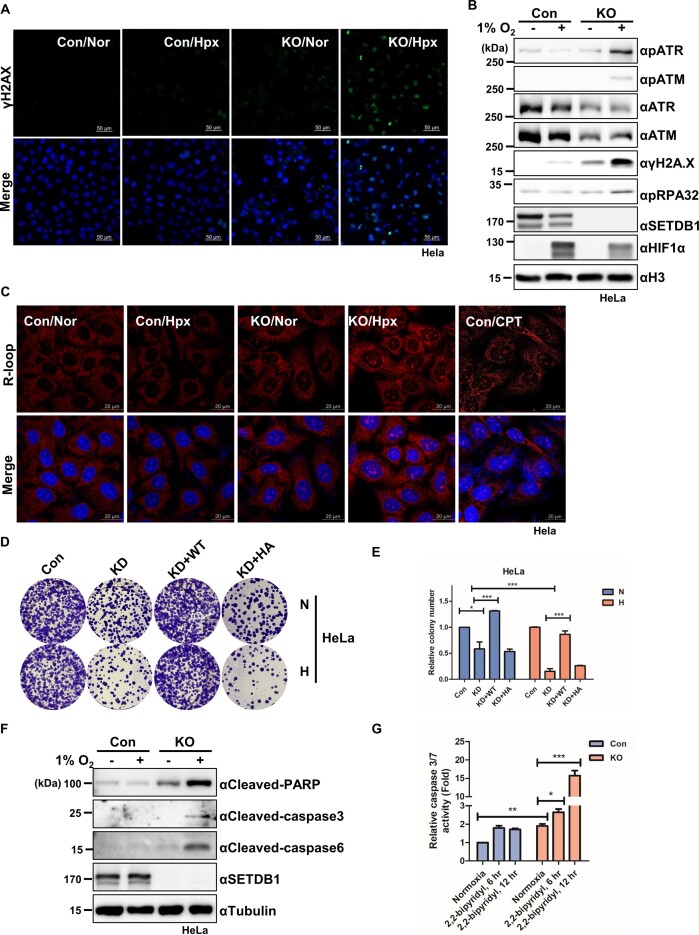
SETDB1 loss in hypoxia leads to cell death via induction of R-loops associated with genome instability (A) Representative images of immunostained γH2AX (green) and DAPI (blue) in SETDB1 KO (KO) and control (Con) HeLa cells under normoxia (Nor) or hypoxia conditions (Hpx, 1% O2 for 24 h). Scale bars denote 20 μm. (B) Immunoblotting of DNA damage markers in SETDB1 KO (KO) and control (Con) HeLa cells under normoxia or hypoxia (1% O2 for 24 h) with the indicated antibodies. (C) Representative images of immunostaining with R-loop (red) and DAPI (blue) in SETDB1 KO (KO) and control (Con) HeLa cells under normoxia (Nor) or hypoxia (Hpx, 1% O2 for 24 h). HeLa cells treated with camptothecin were stained as a positive control. Scale bars denote 20 μm. (D) Colony formation assay (CFA) in SETDB1-depeted (KD), control (Con), Wild-type (WT) SETDB1-rescued (Flag-SETDB1 overexpressing) and catalytic dead H1224A (HA) SETDB1-reintroduced HeLa cells exposed to hypoxia mimetic condition (2,2-bipyridyl, 200 μM for 24 h) followed by normoxic culture (medium change) for 24 d. N: normoxic condition; H: hypoxia mimetic condition. (E) Quantification of relative colony number as described in Figure 6D (*P < 0.05, **P < 0.01, ***P < 0.001, Student's t-test). (F) Immunoblot analysis of apoptosis markers in SETDB1 KO (KO) and control HeLa cells exposed to hypoxic stress (1% O2 for 12 h) with the indicated antibodies. (G) Caspase 3/7 activity in SETDB1 KO (KO) and control HeLa cells exposed to 2,2-bipyridyl (200 μM) for the indicated times assessed with the Caspase-Glo® 3/7 Assay. Relative luminescence units (RLU) reflecting caspase-3 and -7 activity are presented as mean ± SEM (n = 4, *P < 0.05, **P < 0.005, ***P < 0.001, Student's t-test).

